
 Yahoo Finance
 Is Vodafone Group Plc (LON:VOD) A Risky Dividend Stock?
Is Vodafone Group Plc (LON:VOD) a good dividend stock? How would you know? Dividend paying companies with growing earnings can be highly rewarding in the long term. On the other hand, investors have been known to buy a stock because of its yield, and then lose money if the company's dividend doesn't live up to expectations.
In this case, Vodafone Group likely looks attractive to dividend investors, given its 6.4% dividend yield and nine-year payment history. We'd agree the yield does look enticing. The company also bought back stock equivalent to around 1.3% of market capitalisation this year. Some simple analysis can offer a lot of insights when buying a company for its dividend, and we'll go through this below.
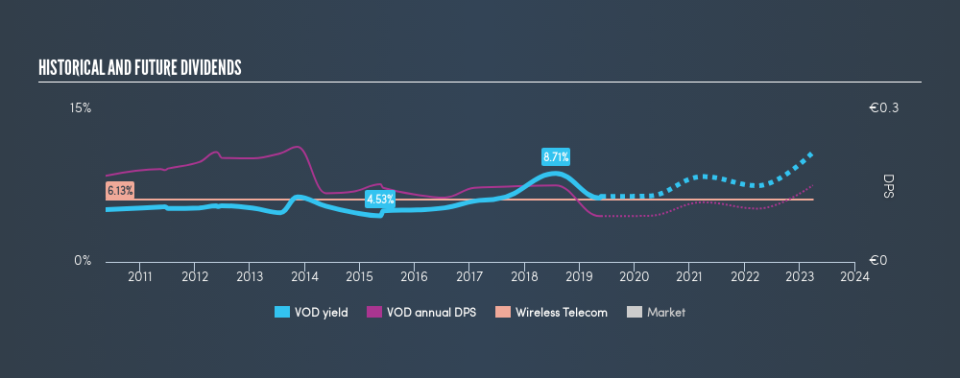
Click the interactive chart for our full dividend analysis
Want to participate in a short research study? Help shape the future of investing tools and you could win a $250 gift card!
Payout ratios
Dividends are usually paid out of company earnings. If a company is paying more than it earns, then the dividend might become unsustainable - hardly an ideal situation. As a result, we should always investigate whether a company can afford its dividend, measured as a percentage of a company's net income after tax. Although it reported a loss over the past 12 months, Vodafone Group currently pays a dividend. When a company is loss-making, we next need to check to see if its cash flows can support the dividend.
Vodafone Group paid out 84% of its cash flow last year. This may be sustainable but it does not leave much of a buffer for unexpected circumstances.
Is Vodafone Group's Balance Sheet Risky?
Given Vodafone Group is paying a dividend but reported a loss over the past year, we need to check its balance sheet for signs of financial distress. A quick way to check a company's financial situation uses these two ratios: net debt divided by EBITDA (earnings before interest, tax, depreciation and amortisation), and net interest cover. Net debt to EBITDA is a measure of a company's total debt. Net interest cover measures the ability to meet interest payments on debt. Essentially we check that a) a company does not have too much debt, and b) that it can afford to pay the interest. Vodafone Group has net debt of 1.97 times its earnings before interest, tax, depreciation and amortisation (EBITDA), which is generally seen as an acceptable level of debt.
We calculated its interest cover by measuring its earnings before interest and tax (EBIT), and dividing this by the company's net interest expense. With EBIT of 2.45 times its interest expense, Vodafone Group's interest cover is starting to look a bit thin.
Consider getting our latest analysis on Vodafone Group's financial position here.
Dividend Volatility
One of the major risks of relying on dividend income, is the potential for a company to struggle financially and cut its dividend. Not only is your income cut, but the value of your investment declines as well - nasty. Looking at the last decade of data, we can see that Vodafone Group paid its first dividend at least nine years ago. Although it has been paying a dividend for several years now, the dividend has been cut at least once by more than 20%, and we're cautious about the consistency of its dividend across a full economic cycle. During the past nine-year period, the first annual payment was €0.17 in 2010, compared to €0.09 last year. This works out to be a decline of approximately 6.8% per year over that time. Vodafone Group's dividend hasn't shrunk linearly at -6.8% per annum, but the CAGR is a useful estimate of the historical rate of change.
Dividend Growth Potential
Given that dividend payments have been shrinking like a glacier in a warming world, we need to check if there are some bright spots on the horizon. Over the past five years, it looks as though Vodafone Group's EPS have declined at around 46% a year. Declining earnings per share over a number of years is not a great sign for the dividend investor. Without some improvement, this does not bode well for the long term value of a company's dividend.
Conclusion
Dividend investors should always want to know if a) a company's dividends are affordable, b) if there is a track record of consistent payments, and c) if the dividend is capable of growing. We're not keen on the fact that Vodafone Group paid dividends despite reporting a loss over the past year, although fortunately its dividend was covered by cash flow. Second, earnings per share have been in decline, and its dividend has been cut at least once in the past. Using these criteria, Vodafone Group looks quite suboptimal from a dividend investment perspective.
Without at least some growth in earnings per share over time, the dividend will eventually come under pressure either from costs or inflation. Businesses can change though, and we think it would make sense to see what analysts are forecasting for the company.
We have also put together a list of global stocks with a market capitalisation above $1bn and yielding more 3%.
We aim to bring you long-term focused research analysis driven by fundamental data. Note that our analysis may not factor in the latest price-sensitive company announcements or qualitative material.
If you spot an error that warrants correction, please contact the editor at editorial-team@simplywallst.com. This article by Simply Wall St is general in nature. It does not constitute a recommendation to buy or sell any stock, and does not take account of your objectives, or your financial situation. Simply Wall St has no position in the stocks mentioned. Thank you for reading.
