
 Yahoo Finance
 W.W. Grainger (NYSE:GWW) Has A Pretty Healthy Balance Sheet

The external fund manager backed by Berkshire Hathaway's Charlie Munger, Li Lu, makes no bones about it when he says 'The biggest investment risk is not the volatility of prices, but whether you will suffer a permanent loss of capital.' When we think about how risky a company is, we always like to look at its use of debt, since debt overload can lead to ruin. Importantly, W.W. Grainger, Inc. (NYSE:GWW) does carry debt. But the real question is whether this debt is making the company risky.
Why Does Debt Bring Risk?
Generally speaking, debt only becomes a real problem when a company can't easily pay it off, either by raising capital or with its own cash flow. In the worst case scenario, a company can go bankrupt if it cannot pay its creditors. However, a more frequent (but still costly) occurrence is where a company must issue shares at bargain-basement prices, permanently diluting shareholders, just to shore up its balance sheet. Having said that, the most common situation is where a company manages its debt reasonably well - and to its own advantage. When we examine debt levels, we first consider both cash and debt levels, together.
View our latest analysis for W.W. Grainger
How Much Debt Does W.W. Grainger Carry?
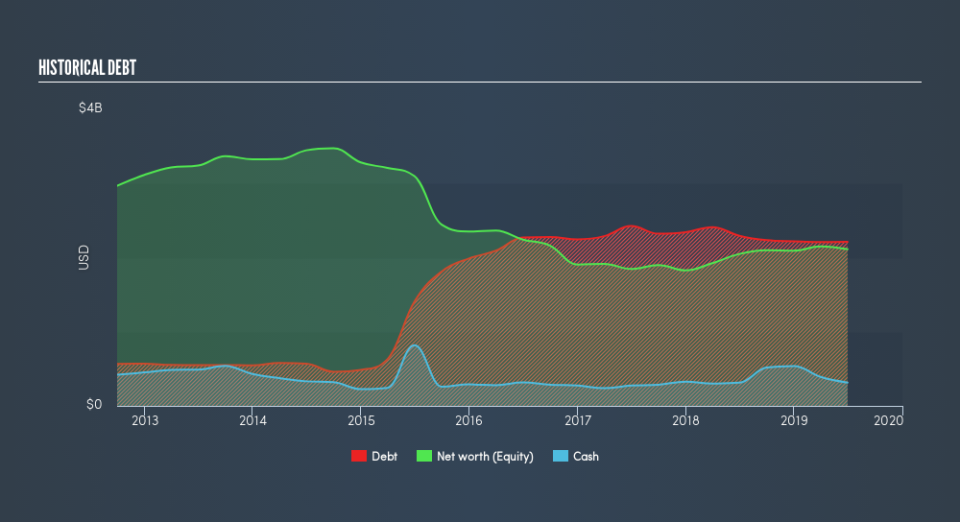
The chart below, which you can click on for greater detail, shows that W.W. Grainger had US$2.21b in debt in June 2019; about the same as the year before. However, it does have US$315.0m in cash offsetting this, leading to net debt of about US$1.90b.
How Strong Is W.W. Grainger's Balance Sheet?
According to the last reported balance sheet, W.W. Grainger had liabilities of US$1.45b due within 12 months, and liabilities of US$2.43b due beyond 12 months. Offsetting these obligations, it had cash of US$315.0m as well as receivables valued at US$1.50b due within 12 months. So its liabilities outweigh the sum of its cash and (near-term) receivables by US$2.06b.
Given W.W. Grainger has a humongous market capitalization of US$14.7b, it's hard to believe these liabilities pose much threat. But there are sufficient liabilities that we would certainly recommend shareholders continue to monitor the balance sheet, going forward.
In order to size up a company's debt relative to its earnings, we calculate its net debt divided by its earnings before interest, tax, depreciation, and amortization (EBITDA) and its earnings before interest and tax (EBIT) divided by its interest expense (its interest cover). This way, we consider both the absolute quantum of the debt, as well as the interest rates paid on it.
W.W. Grainger has a low net debt to EBITDA ratio of only 1.2. And its EBIT easily covers its interest expense, being 18.5 times the size. So you could argue it is no more threatened by its debt than an elephant is by a mouse. Fortunately, W.W. Grainger grew its EBIT by 9.0% in the last year, making that debt load look even more manageable. When analysing debt levels, the balance sheet is the obvious place to start. But it is future earnings, more than anything, that will determine W.W. Grainger's ability to maintain a healthy balance sheet going forward. So if you want to see what the professionals think, you might find this free report on analyst profit forecasts to be interesting.
Finally, a company can only pay off debt with cold hard cash, not accounting profits. So the logical step is to look at the proportion of that EBIT that is matched by actual free cash flow. During the last three years, W.W. Grainger produced sturdy free cash flow equating to 65% of its EBIT, about what we'd expect. This free cash flow puts the company in a good position to pay down debt, when appropriate.
Our View
The good news is that W.W. Grainger's demonstrated ability to cover its interest expense with its EBIT delights us like a fluffy puppy does a toddler. And that's just the beginning of the good news since its conversion of EBIT to free cash flow is also very heartening. Taking all this data into account, it seems to us that W.W. Grainger takes a pretty sensible approach to debt. While that brings some risk, it can also enhance returns for shareholders. Above most other metrics, we think its important to track how fast earnings per share is growing, if at all. If you've also come to that realization, you're in luck, because today you can view this interactive graph of W.W. Grainger's earnings per share history for free.
Of course, if you're the type of investor who prefers buying stocks without the burden of debt, then don't hesitate to discover our exclusive list of net cash growth stocks, today.
We aim to bring you long-term focused research analysis driven by fundamental data. Note that our analysis may not factor in the latest price-sensitive company announcements or qualitative material.
If you spot an error that warrants correction, please contact the editor at editorial-team@simplywallst.com. This article by Simply Wall St is general in nature. It does not constitute a recommendation to buy or sell any stock, and does not take account of your objectives, or your financial situation. Simply Wall St has no position in the stocks mentioned. Thank you for reading.
