
 Yahoo Finance
 Be Wary Of Baidu (NASDAQ:BIDU) And Its Returns On Capital
There are a few key trends to look for if we want to identify the next multi-bagger. In a perfect world, we'd like to see a company investing more capital into its business and ideally the returns earned from that capital are also increasing. If you see this, it typically means it's a company with a great business model and plenty of profitable reinvestment opportunities. However, after briefly looking over the numbers, we don't think Baidu (NASDAQ:BIDU) has the makings of a multi-bagger going forward, but let's have a look at why that may be.
Return On Capital Employed (ROCE): What is it?
Just to clarify if you're unsure, ROCE is a metric for evaluating how much pre-tax income (in percentage terms) a company earns on the capital invested in its business. To calculate this metric for Baidu, this is the formula:
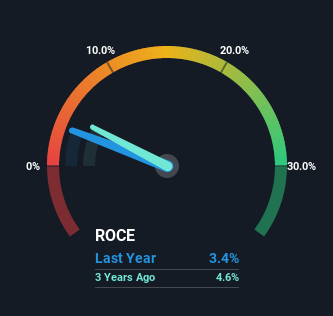
Return on Capital Employed = Earnings Before Interest and Tax (EBIT) ÷ (Total Assets - Current Liabilities)
0.034 = CN¥10b ÷ (CN¥376b - CN¥68b) (Based on the trailing twelve months to March 2022).
So, Baidu has an ROCE of 3.4%. Ultimately, that's a low return and it under-performs the Interactive Media and Services industry average of 5.1%.
See our latest analysis for Baidu
In the above chart we have measured Baidu's prior ROCE against its prior performance, but the future is arguably more important. If you're interested, you can view the analysts predictions in our free report on analyst forecasts for the company.
What The Trend Of ROCE Can Tell Us
On the surface, the trend of ROCE at Baidu doesn't inspire confidence. Over the last five years, returns on capital have decreased to 3.4% from 7.2% five years ago. However, given capital employed and revenue have both increased it appears that the business is currently pursuing growth, at the consequence of short term returns. And if the increased capital generates additional returns, the business, and thus shareholders, will benefit in the long run.
On a related note, Baidu has decreased its current liabilities to 18% of total assets. That could partly explain why the ROCE has dropped. What's more, this can reduce some aspects of risk to the business because now the company's suppliers or short-term creditors are funding less of its operations. Some would claim this reduces the business' efficiency at generating ROCE since it is now funding more of the operations with its own money.
The Bottom Line
While returns have fallen for Baidu in recent times, we're encouraged to see that sales are growing and that the business is reinvesting in its operations. And there could be an opportunity here if other metrics look good too, because the stock has declined 23% in the last five years. So we think it'd be worthwhile to look further into this stock given the trends look encouraging.
While Baidu doesn't shine too bright in this respect, it's still worth seeing if the company is trading at attractive prices. You can find that out with our FREE intrinsic value estimation on our platform.
If you want to search for solid companies with great earnings, check out this free list of companies with good balance sheets and impressive returns on equity.
Have feedback on this article? Concerned about the content? Get in touch with us directly. Alternatively, email editorial-team (at) simplywallst.com.
This article by Simply Wall St is general in nature. We provide commentary based on historical data and analyst forecasts only using an unbiased methodology and our articles are not intended to be financial advice. It does not constitute a recommendation to buy or sell any stock, and does not take account of your objectives, or your financial situation. We aim to bring you long-term focused analysis driven by fundamental data. Note that our analysis may not factor in the latest price-sensitive company announcements or qualitative material. Simply Wall St has no position in any stocks mentioned.
