
 Yahoo Finance
 Will Weakness in Globe International Limited's (ASX:GLB) Stock Prove Temporary Given Strong Fundamentals?
It is hard to get excited after looking at Globe International's (ASX:GLB) recent performance, when its stock has declined 19% over the past three months. However, stock prices are usually driven by a company’s financial performance over the long term, which in this case looks quite promising. Particularly, we will be paying attention to Globe International's ROE today.
Return on equity or ROE is a key measure used to assess how efficiently a company's management is utilizing the company's capital. In simpler terms, it measures the profitability of a company in relation to shareholder's equity.
See our latest analysis for Globe International
How Is ROE Calculated?
The formula for ROE is:
Return on Equity = Net Profit (from continuing operations) ÷ Shareholders' Equity
So, based on the above formula, the ROE for Globe International is:
25% = AU$19m ÷ AU$76m (Based on the trailing twelve months to June 2022).
The 'return' is the income the business earned over the last year. Another way to think of that is that for every A$1 worth of equity, the company was able to earn A$0.25 in profit.
Why Is ROE Important For Earnings Growth?
Thus far, we have learned that ROE measures how efficiently a company is generating its profits. We now need to evaluate how much profit the company reinvests or "retains" for future growth which then gives us an idea about the growth potential of the company. Assuming all else is equal, companies that have both a higher return on equity and higher profit retention are usually the ones that have a higher growth rate when compared to companies that don't have the same features.
Globe International's Earnings Growth And 25% ROE
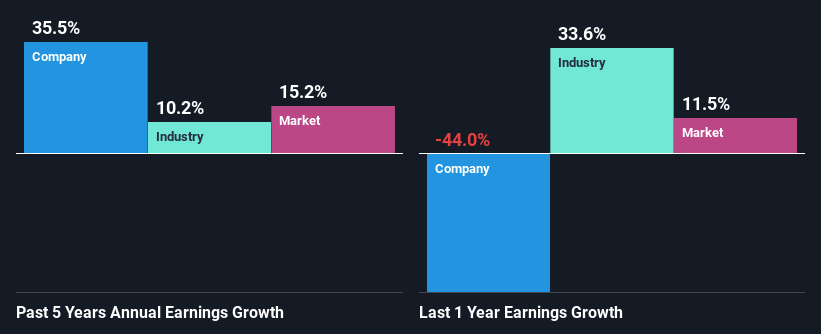
To begin with, Globe International has a pretty high ROE which is interesting. Second, a comparison with the average ROE reported by the industry of 11% also doesn't go unnoticed by us. As a result, Globe International's exceptional 36% net income growth seen over the past five years, doesn't come as a surprise.
As a next step, we compared Globe International's net income growth with the industry, and pleasingly, we found that the growth seen by the company is higher than the average industry growth of 10%.
Earnings growth is a huge factor in stock valuation. What investors need to determine next is if the expected earnings growth, or the lack of it, is already built into the share price. By doing so, they will have an idea if the stock is headed into clear blue waters or if swampy waters await. If you're wondering about Globe International's's valuation, check out this gauge of its price-to-earnings ratio, as compared to its industry.
Is Globe International Using Its Retained Earnings Effectively?
Globe International's significant three-year median payout ratio of 57% (where it is retaining only 43% of its income) suggests that the company has been able to achieve a high growth in earnings despite returning most of its income to shareholders.
Besides, Globe International has been paying dividends for at least ten years or more. This shows that the company is committed to sharing profits with its shareholders.
Conclusion
Overall, we are quite pleased with Globe International's performance. We are particularly impressed by the considerable earnings growth posted by the company, which was likely backed by its high ROE. While the company is paying out most of its earnings as dividends, it has been able to grow its earnings in spite of it, so that's probably a good sign. Up till now, we've only made a short study of the company's growth data. You can do your own research on Globe International and see how it has performed in the past by looking at this FREE detailed graph of past earnings, revenue and cash flows.
Have feedback on this article? Concerned about the content? Get in touch with us directly. Alternatively, email editorial-team (at) simplywallst.com.
This article by Simply Wall St is general in nature. We provide commentary based on historical data and analyst forecasts only using an unbiased methodology and our articles are not intended to be financial advice. It does not constitute a recommendation to buy or sell any stock, and does not take account of your objectives, or your financial situation. We aim to bring you long-term focused analysis driven by fundamental data. Note that our analysis may not factor in the latest price-sensitive company announcements or qualitative material. Simply Wall St has no position in any stocks mentioned.
Join A Paid User Research Session
You’ll receive a US$30 Amazon Gift card for 1 hour of your time while helping us build better investing tools for the individual investors like yourself. Sign up here
