
 Yahoo Finance
 How Has Wee Hur Holdings Ltd’s (SGX:E3B) Performed Against The Industry?

Measuring Wee Hur Holdings Ltd’s (SGX:E3B) track record of past performance is an insightful exercise for investors. It enables us to reflect on whether the company has met or exceed expectations, which is a powerful signal for future performance. Below, I will assess E3B’s recent performance announced on 30 June 2018 and compare these figures to its historical trend and industry movements.
See our latest analysis for Wee Hur Holdings
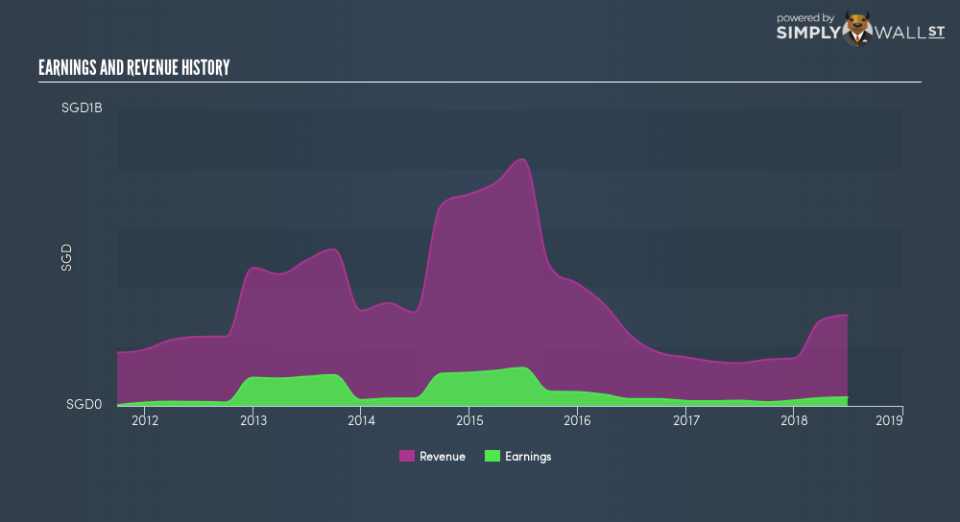
Were E3B’s earnings stronger than its past performances and the industry?
E3B’s trailing twelve-month earnings (from 30 June 2018) of S$29.3m has jumped 66.3% compared to the previous year.
Furthermore, this one-year growth rate has exceeded its 5-year annual growth average of -6.0%, indicating the rate at which E3B is growing has accelerated. What’s the driver of this growth? Let’s see if it is only attributable to industry tailwinds, or if Wee Hur Holdings has experienced some company-specific growth.
Though both top-line and bottom-line growth rates in the past few years were on average negative, earnings were more so. While this has caused a margin contraction, it has softened Wee Hur Holdings’s earnings contraction.
Looking at growth from a sector-level, the SG construction industry has been relatively flat in terms of earnings growth . Thought this is a bit of a change from a volatile drop of -2.6% in the past couple of years. This growth is a median of profitable companies of 21 Construction companies in SG including Swee Hong, OKP Holdings and Mun Siong Engineering. This means whatever near-term headwind the industry is experiencing, the impact on Wee Hur Holdings has been softer relative to its peers.
In terms of returns from investment, Wee Hur Holdings has fallen short of achieving a 20% return on equity (ROE), recording 10.2% instead. Furthermore, its return on assets (ROA) of 3.5% is below the SG Construction industry of 4.0%, indicating Wee Hur Holdings’s are utilized less efficiently. And finally, its return on capital (ROC), which also accounts for Wee Hur Holdings’s debt level, has declined over the past 3 years from 53.3% to 10.6%. This correlates with an increase in debt holding, with debt-to-equity ratio rising from 61.2% to 74.4% over the past 5 years.
What does this mean?
Wee Hur Holdings’s track record can be a valuable insight into its earnings performance, but it certainly doesn’t tell the whole story. Recent positive growth doesn’t necessarily mean it’s onwards and upwards for the company. I suggest you continue to research Wee Hur Holdings to get a better picture of the stock by looking at:
Future Outlook: What are well-informed industry analysts predicting for E3B’s future growth? Take a look at our free research report of analyst consensus for E3B’s outlook.
Financial Health: Are E3B’s operations financially sustainable? Balance sheets can be hard to analyze, which is why we’ve done it for you. Check out our financial health checks here.
Other High-Performing Stocks: Are there other stocks that provide better prospects with proven track records? Explore our free list of these great stocks here.
NB: Figures in this article are calculated using data from the trailing twelve months from 30 June 2018. This may not be consistent with full year annual report figures.
To help readers see past the short term volatility of the financial market, we aim to bring you a long-term focused research analysis purely driven by fundamental data. Note that our analysis does not factor in the latest price-sensitive company announcements.
The author is an independent contributor and at the time of publication had no position in the stocks mentioned. For errors that warrant correction please contact the editor at editorial-team@simplywallst.com.
