
 Yahoo Finance
 Welltower (HCN) Q4 FFO Misses Estimates, Revenues Up Y/Y

Welltower, Inc. HCN reported normalized funds from operations (FFO) per share of $1.02 for fourth-quarter 2017, missing the Zacks Consensus Estimate of $1.04. Further, on a year-over-year basis, the figure declined 7.3% from $1.10.
Results reflect an increase of 10.7% in property operating expenses.
Further, the company recorded revenues of $1.10 billion, which beat the Zacks Consensus Estimate of $1.08 billion. Also, revenues inched up 1.9% from the year-ago tally.
For the full year 2017, normalized FFO per share came in at $4.21, 7.5% lower than the year-ago figure of $4.55. However, revenues for the full-year came in at $4.32 billion, up nearly 1% from $4.28 billion reported in 2016.
The company recently announced that it will be changing its ticker on NYSE from HCN to WELL, effective from Feb 28, 2018.
Quarter in Detail
Total portfolio same-store net operating income (SSNOI) grew 2.1% year over year, driven by growth in all the segments.
Welltower accomplished $334 million of pro rata gross investments in the fourth quarter. This included $223 million in acquisitions/joint ventures, $108 million in development funding as well as $3 million in loans. Notably, the company completed 80% of these investments with present relationships.
On the other hand, the company accomplished total dispositions of $142 million in the quarter. This comprised loan payoffs of $28 million and property sales of $114 million.
The company exited fourth-quarter 2017 with $243.8 million of cash and cash equivalents, down from $419.5 million recorded at the end of the prior-year quarter. In addition, as of Dec 31, 2017, the company had $2.3 billion of available borrowing capacity under its primary unsecured credit facility. Furthermore, it extinguished secured debt of $137 million during the reported quarter.
Welltower generated proceeds of about $89 million with an average price of $67.06 under the ATM and DRIP programs.
2018 Outlook
Welltower has provided guidance for 2018. The company expects normalized FFO per share in the range of $3.95–$4.05. Also, the company anticipates its same-store NOI growth to remain in the range of 1-2%.
Further, in sync with the strategic repositioning of its premier healthcare portfolio, the company expects 2018 disposition to be around $1.3 billion.
Our Take
Welltower is set to acquire a portfolio of four rental continuing care retirement communities CCRCs and convert those to a RIDEA structure. Further, it has secured a major institutional investor for the development of an assisted-living and memory-care community in midtown Manhattan.
Although these moves fortify its healthcare asset portfolio, increase in the supply of seniors’ housing assets in certain markets remains a pressure point. It curbs landlords’ pricing power and also limits any robust occupancy growth.
Additionally, the rate hike is a concern for the company because of its high exposure to long-term leased assets. Further, aggressive disposition of non-core assets puts pressure on Welltower’s bottom-line performance.
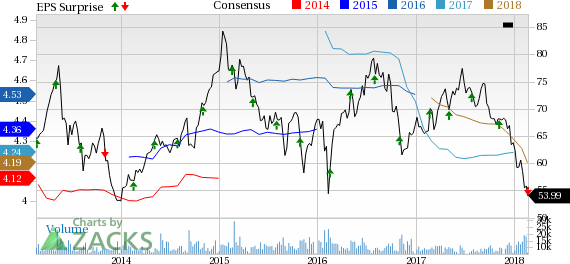
Welltower Inc. Price, Consensus and EPS Surprise
Welltower Inc. Price, Consensus and EPS Surprise | Welltower Inc. Quote
Currently, Welltower carries a Zacks Rank #4 (Sell).
You can see the complete list of today’s Zacks #1 Rank (Strong Buy) stocks here.
Performance of Other REITs
Ventas, Inc. VTR reported fourth-quarter 2017 normalized FFO of $1.03 per share, in line with the Zacks Consensus Estimate. The figure also matched the year-ago quarter tally. Results reflect improved property performance and accretive investments.
Cousins Properties Inc. CUZ reported fourth-quarter 2017 FFO per share of 15 cents, surpassing the Zacks Consensus Estimate by a penny. Results reflect better-than-expected revenues in the quarter. Further, a rise in second-generation net rent-per-square-foot on a cash basis was experienced.
PS Business Parks, Inc. PSB reported fourth-quarter 2017 core FFO of $1.52 per share, missing the Zacks Consensus Estimate by a penny. However, the figure came in 9.4%, higher than $1.39 recorded in the prior-year quarter. The rise on a year-over-year basis stemmed from higher NOI, reduced general and administrative expenses and savings from lower preferred distributions.
Note: Anything related to earnings presented in this write-up represent funds from operations (FFO) — a widely used metric to gauge the performance of REITs.
More Stock News: This is Bigger Than the iPhone!
It could become the mother of all technological revolutions. Apple sold a mere 1 billion iPhones in 10 years but a new breakthrough is expected to generate more than 27 billion devices in just 3 years, creating a $1.7 trillion market.
Zacks has just released a Special Report that spotlights this fast-emerging phenomenon and 6 tickers for taking advantage of it. If you don't buy now, you may kick yourself in 2020.
Click here for the 6 trades >>
Want the latest recommendations from Zacks Investment Research? Today, you can download 7 Best Stocks for the Next 30 Days. Click to get this free report
Ventas, Inc. (VTR) : Free Stock Analysis Report
Welltower Inc. (HCN) : Free Stock Analysis Report
Cousins Properties Incorporated (CUZ) : Free Stock Analysis Report
PS Business Parks, Inc. (PSB) : Free Stock Analysis Report
To read this article on Zacks.com click here.
Zacks Investment Research
