
 Yahoo Finance
 We're Keeping An Eye On HPQ Silicon's (CVE:HPQ) Cash Burn Rate
We can readily understand why investors are attracted to unprofitable companies. For example, biotech and mining exploration companies often lose money for years before finding success with a new treatment or mineral discovery. But while the successes are well known, investors should not ignore the very many unprofitable companies that simply burn through all their cash and collapse.
So, the natural question for HPQ Silicon (CVE:HPQ) shareholders is whether they should be concerned by its rate of cash burn. In this article, we define cash burn as its annual (negative) free cash flow, which is the amount of money a company spends each year to fund its growth. We'll start by comparing its cash burn with its cash reserves in order to calculate its cash runway.
View our latest analysis for HPQ Silicon
Does HPQ Silicon Have A Long Cash Runway?
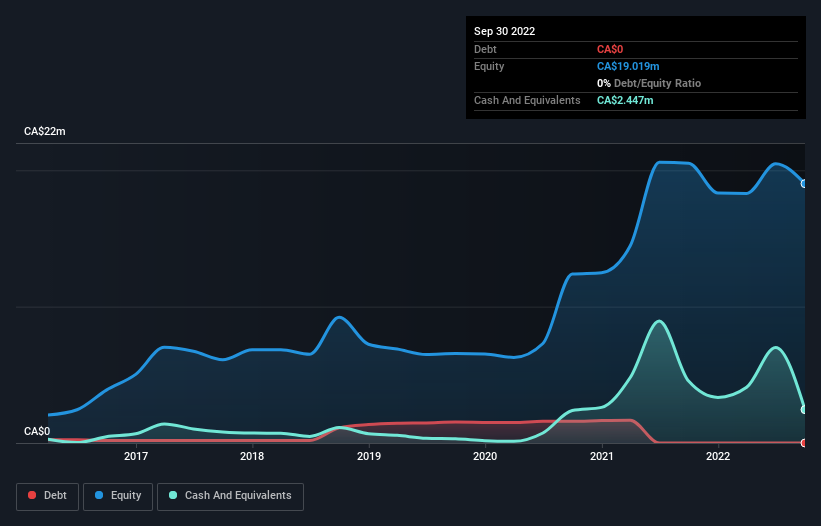
A cash runway is defined as the length of time it would take a company to run out of money if it kept spending at its current rate of cash burn. In September 2022, HPQ Silicon had CA$2.4m in cash, and was debt-free. Looking at the last year, the company burnt through CA$4.0m. So it had a cash runway of approximately 7 months from September 2022. To be frank, this kind of short runway puts us on edge, as it indicates the company must reduce its cash burn significantly, or else raise cash imminently. The image below shows how its cash balance has been changing over the last few years.
How Is HPQ Silicon's Cash Burn Changing Over Time?
Because HPQ Silicon isn't currently generating revenue, we consider it an early-stage business. Nonetheless, we can still examine its cash burn trajectory as part of our assessment of its cash burn situation. Given the length of the cash runway, we'd interpret the 30% reduction in cash burn, in twelve months, as prudent if not necessary for capital preservation. HPQ Silicon makes us a little nervous due to its lack of substantial operating revenue. So we'd generally prefer stocks from this list of stocks that have analysts forecasting growth.
Can HPQ Silicon Raise More Cash Easily?
Even though it has reduced its cash burn recently, shareholders should still consider how easy it would be for HPQ Silicon to raise more cash in the future. Generally speaking, a listed business can raise new cash through issuing shares or taking on debt. Many companies end up issuing new shares to fund future growth. By looking at a company's cash burn relative to its market capitalisation, we gain insight on how much shareholders would be diluted if the company needed to raise enough cash to cover another year's cash burn.
Since it has a market capitalisation of CA$93m, HPQ Silicon's CA$4.0m in cash burn equates to about 4.3% of its market value. Given that is a rather small percentage, it would probably be really easy for the company to fund another year's growth by issuing some new shares to investors, or even by taking out a loan.
So, Should We Worry About HPQ Silicon's Cash Burn?
On this analysis of HPQ Silicon's cash burn, we think its cash burn relative to its market cap was reassuring, while its cash runway has us a bit worried. We don't think its cash burn is particularly problematic, but after considering the range of factors in this article, we do think shareholders should be monitoring how it changes over time. Taking a deeper dive, we've spotted 7 warning signs for HPQ Silicon you should be aware of, and 3 of them are potentially serious.
Of course, you might find a fantastic investment by looking elsewhere. So take a peek at this free list of companies insiders are buying, and this list of stocks growth stocks (according to analyst forecasts)
Have feedback on this article? Concerned about the content? Get in touch with us directly. Alternatively, email editorial-team (at) simplywallst.com.
This article by Simply Wall St is general in nature. We provide commentary based on historical data and analyst forecasts only using an unbiased methodology and our articles are not intended to be financial advice. It does not constitute a recommendation to buy or sell any stock, and does not take account of your objectives, or your financial situation. We aim to bring you long-term focused analysis driven by fundamental data. Note that our analysis may not factor in the latest price-sensitive company announcements or qualitative material. Simply Wall St has no position in any stocks mentioned.
Join A Paid User Research Session
You’ll receive a US$30 Amazon Gift card for 1 hour of your time while helping us build better investing tools for the individual investors like yourself. Sign up here
