
 Yahoo Finance
 Where Seeka Limited’s (NZSE:SEK) Earnings Growth Stands Against Its Industry

After reading Seeka Limited’s (NZSE:SEK) latest earnings update (30 June 2018), I found it beneficial to look back at how the company has performed in the past and compare this against the most recent numbers. As a long-term investor I tend to pay attention to earnings trend, rather than a single number at one point in time. I also like to compare against an industry benchmark to understand whether SEK has outperformed, or whether it is simply riding an industry wave. Below is a brief commentary on my key takeaways.
Check out our latest analysis for Seeka
Was SEK’s weak performance lately a part of a long-term decline?
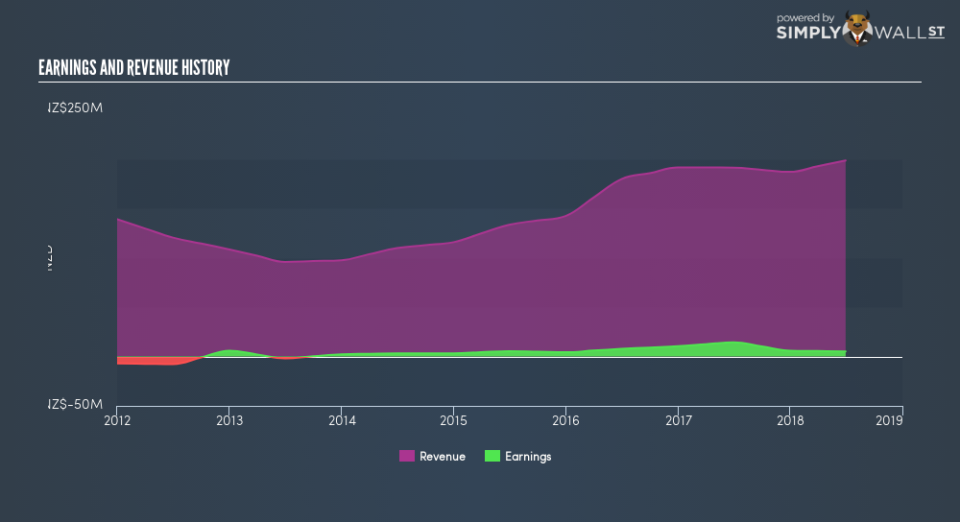
SEK’s trailing twelve-month earnings (from 30 June 2018) of NZ$5.1m has more than halved from NZ$10.4m in the prior year.
Furthermore, this one-year growth rate has been lower than its average earnings growth rate over the past 5 years of 39.8%, indicating the rate at which SEK is growing has slowed down. Why could this be happening? Well, let’s take a look at what’s going on with margins and whether the rest of the industry is feeling the heat.
Over the past couple of years, revenue growth has not been able to catch up, which implies that Seeka’s bottom line has been propelled by unsustainable cost-cutting.
Scanning growth from a sector-level, the NZ food industry has been enduring some headwinds in the prior twelve months, leading to an average earnings drop of -23.6%. This is a major change, given that the industry has constantly been delivering a a solid growth of 37.4% in the last five years. This growth is a median of profitable companies of 10 Food companies in NZ including PGG Wrightson, Livestock Improvement and T&G Global. This shows that whatever recent headwind the industry is facing, it’s hitting Seeka harder than its peers.
In terms of returns from investment, Seeka has fallen short of achieving a 20% return on equity (ROE), recording 4.7% instead. Furthermore, its return on assets (ROA) of 3.0% is below the NZ Food industry of 6.4%, indicating Seeka’s are utilized less efficiently. And finally, its return on capital (ROC), which also accounts for Seeka’s debt level, has declined over the past 3 years from 7.4% to 4.7%. This correlates with an increase in debt holding, with debt-to-equity ratio rising from 42.2% to 109% over the past 5 years.
What does this mean?
While past data is useful, it doesn’t tell the whole story. Companies that are profitable, but have volatile earnings, can have many factors influencing its business. I suggest you continue to research Seeka to get a more holistic view of the stock by looking at:
Future Outlook: What are well-informed industry analysts predicting for SEK’s future growth? Take a look at our free research report of analyst consensus for SEK’s outlook.
Financial Health: Are SEK’s operations financially sustainable? Balance sheets can be hard to analyze, which is why we’ve done it for you. Check out our financial health checks here.
Other High-Performing Stocks: Are there other stocks that provide better prospects with proven track records? Explore our free list of these great stocks here.
NB: Figures in this article are calculated using data from the trailing twelve months from 30 June 2018. This may not be consistent with full year annual report figures.
To help readers see past the short term volatility of the financial market, we aim to bring you a long-term focused research analysis purely driven by fundamental data. Note that our analysis does not factor in the latest price-sensitive company announcements.
The author is an independent contributor and at the time of publication had no position in the stocks mentioned. For errors that warrant correction please contact the editor at editorial-team@simplywallst.com.
