
 Yahoo Finance
 Why is Earnings Beat Less Likely for BNY Mellon (BK) in Q2?

The Bank of New York Mellon Corporation BK is scheduled to report second-quarter 2018 results on Jul 19, before the market opens. Its revenues and earnings are expected to grow year over year.
In the last reported quarter, the company’s earnings surpassed the Zacks Consensus Estimate. Higher revenues and assets under management (AUM) growth were partially offset by rise in expenses.
Moreover, BNY Mellon has an impressive earnings surprise history. Its earnings did not lag the Zacks Consensus Estimate in any of the trailing four quarters. The average positive surprise was 7.1%.
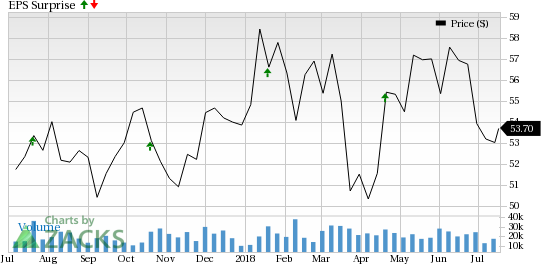
The Bank of New York Mellon Corporation Price and EPS Surprise
The Bank of New York Mellon Corporation Price and EPS Surprise | The Bank of New York Mellon Corporation Quote
However, activities of the company in the second quarter were not adequate to win analysts’ confidence. As a result, the Zacks Consensus Estimate of $1.03 has remained unchanged over the past 30 days. Nevertheless, the figure reflects year-over-year growth of nearly 12%.
Further, the company’s Zacks Consensus Estimate for sales for the to-be-reported quarter is $4.14 billion, reflecting an improvement of nearly 5% year over year.
BNY Mellon’s price performance does not look impressive. Its shares have gained merely 0.3% in the past year, underperforming the 7.7% rally of the industry it belongs to.
Will the price performance improve post Q2 earnings? To a great extent, it depends on whether the company will be able to beat earnings estimates this time around.
Before we take a look at what our quantitative model predicts, let’s check the factors that are likely to impact Q2 results.
Factors to Influence Q2 Results
Dismal Fee Revenue Performance: While the equity trading volumes declined sequentially during the second quarter, negatively impacting the amount of securities on loans, the spread between the three-month LIBOR and the Fed funds rate improved. Thus, supported by wider spreads, securities lending revenues are expected to modestly improve during the to-be-reported quarter, thereby, boosting BNY Mellon’s asset servicing fees to some extent.
Notably, the Zacks Consensus Estimate for AUM of $1.9 trillion for the second quarter reflects marginal growth sequentially. Also, the Zacks Consensus Estimate for total assets under custody and administration of $34.1 trillion reflects growth of 1.8% sequentially. Thus, while the performance of the equity markets was not great during the second quarter, investment management and performance fees are likely to be slightly positively impacted by expected growth in assets.
However, given the sequential decline in foreign exchange trading volumes, as well as decreased volatility during the second quarter, foreign exchange trading revenues are likely to decline.
Notably, the Zacks Consensus Estimate for fee revenues for the second quarter is $3.24 billion, reflecting a decline of 2.5% sequentially.
Net Interest Revenues (NIR) Growth to Provide Support: While loan growth during the second quarter was not very impressive, a modest improvement in the lending scenario particularly commercial real estate loans, along with the benefits of rising interest rates, is expected to positively impact BNY Mellon’s NIR.
Moreover, management believes, any rate hike is likely to lead to an improvement in net interest margin (NIM) as well as NIR. Hence, improving margins, due to the increase in rates, are likely to more than offset the reduced size of balance sheet and hence, lead to a modest increase in NIR as well.
Expenses to Decline Slightly: Supported by the cost-saving initiatives, BNY Mellon’s expenses have been declining for the past few years. Moreover, despite the impact of investment-related expenses, overall costs are expected to remain low in the quarter under review.
Now, let’s take a look at what our quantitative model predicts.
According to our quantitative model, chances of BNY Mellon beating the Zacks Consensus Estimate in the second quarter are low. This is because it does not have the right combination of the two key ingredients — a positive Earnings ESP and a Zacks Rank #3 (Hold) or better — which is required to increase the odds of an earnings beat.
You can uncover the best stocks to buy or sell before they’re reported with our Earnings ESP Filter.
Zacks ESP: The Earnings ESP for BNY Mellon is -0.19%.
Zacks Rank: BNY Mellon currently carries a Zacks Rank of 3. While this increases the predictive power of ESP, we also need a positive ESP to be reasonably confident of an earnings beat.
Stocks That Warrant a Look
Here are a few finance stocks that you may want to consider, as our model shows that these have the right combination of elements to post an earnings beat this time around.
KeyCorp KEY is scheduled to release results on Jul 19. It has an Earnings ESP of +0.32% and currently carries a Zacks Rank #2 (Buy). You can see the complete list of today’s Zacks #1 Rank (Strong Buy) stocks here.
E*TRADE Financial Corp. ETFC has an Earnings ESP of +0.11% and presently carries a Zacks Rank of 3. The company is also slated to release results on Jul 19.
SunTrust Banks, Inc. STI is slated to release results on Jul 20. It has an Earnings ESP of +0.21% and currently carries a Zacks Rank #2.
Today's Stocks from Zacks' Hottest Strategies
It's hard to believe, even for us at Zacks. But while the market gained +21.9% in 2017, our top stock-picking screens have returned +115.0%, +109.3%, +104.9%, +98.6% and +67.1%.
And this outperformance has not just been a recent phenomenon. Over the years it has been remarkably consistent. From 2000 - 2017, the composite yearly average gain for these strategies has beaten the market more than 19X over. Maybe even more remarkable is the fact that we're willing to share their latest stocks with you without cost or obligation.
See Them Free>>
Want the latest recommendations from Zacks Investment Research? Today, you can download 7 Best Stocks for the Next 30 Days. Click to get this free report
SunTrust Banks, Inc. (STI) : Free Stock Analysis Report
KeyCorp (KEY) : Free Stock Analysis Report
The Bank of New York Mellon Corporation (BK) : Free Stock Analysis Report
E*TRADE Financial Corporation (ETFC) : Free Stock Analysis Report
To read this article on Zacks.com click here.
Zacks Investment Research
