
 Yahoo Finance
 Why Is Expedia (EXPE) Down 14% Since its Last Earnings Report?

It has been about a month since the last earnings report for Expedia, Inc. EXPE. Shares have lost about 14% in that time frame.
Will the recent negative trend continue leading up to its next earnings release, or is EXPE due for a breakout? Before we dive into how investors and analysts have reacted as of late, let's take a quick look at its most recent earnings report in order to get a better handle on the important catalysts.
Recent Earnings
Expedia reported fourth-quarter 2017 non-GAAP earnings of 84 cents, down 28.2% from the year-ago quarter and 66.5% from the previous quarter. The figure also missed the Zacks Consensus Estimate by 32 cents.
Revenues were up 10.8% year over year but declined 21.8% sequentially to $2.32 billion and lagged the Zacks Consensus Estimate of $2.37 billion. Gross bookings increased 13.6% year over year but declined 11% sequentially to $19.77 billion.
Revenues by Segment
Core OTA segment revenues were up 9.6% year over year but fell 19.7% on a sequential basis to $1.86 billion. Management noted that OTA lodging supply portfolio is at about 590,000 properties, up 69% on a year-over-year basis.
Moreover, trivago revenues declined 36.4% sequentially but increased 17.5% from the year-ago quarter to $215 million.
Egencia increased 8.7% on a sequential basis and 18.1% on a year-over-year basis to $137 million.
HomeAway increased 16.3% from the year-ago quarter but declined 36.7% sequentially to $193 million. HomeAway room nights stayed rose 30% year over year.
Core OTA, trivago, Egencia and HomeAway contributed 80.1%, 9.3%, 5.9% and 8.3% of gross revenues (before inter-company eliminations), respectively.
Revenues by Channel
Around 55.3% of total revenues were generated through the merchant business (direct sales), another 27.1% came through the agency model (where Expedia operates as an agent of the supplier). Roughly 8.2% came from Advertising & Media with Home Away, accounting for the remaining 8.3%.
Merchant, Agency, Advertising & Media and Home Away were up 9.7%, 10.9%, 12.6% and 16.3%, respectively, on a year-over-year basis. Sequentially, Merchant, Agency, Advertising & Media and Home Away plunged 17.7%, 21.7%, 28.4% and 36.7%, respectively.
Revenues by Geography
Around 54% of Expedia’s quarterly revenues were generated domestically, with the remaining 46% coming from international sources. The domestic business climbed 4.4% from the year-ago quarter but declined 20.6% sequentially. The international business grew 19.5% from the year-ago quarter but declined 23.2% sequentially.
Revenues by Product Line
Lodging revenues (69% of total revenues), which include hotel and HomeAway revenues, increased 11% in the quarter based on a 15% increase in room nights stayed driven by growth in Brand Expedia, Hotels.com, EAN and HomeAway.
Air revenues were flat. Almost 3% increase in air tickets sold was offset by a 3% decrease in revenues per ticket.
The 13% year-over-year growth advertising & media revenue reflected continued growth in trivago and Expedia Media Solutions. All other revenues increased 14%, reflecting growth in travel insurance and car rental products.
Operating Details
Adjusted gross margin contracted 310 basis points (bps) on a sequential basis and 80 bps on year-over-year basis to 82.4%.
Adjusted EBITDA plunged 43.3% sequentially and 9% year over year to $402 million. Notably, trivago, Egencia and Home Away EBITDA decreased 164.3%, 9.5% and 26.2%, respectively, on a year-over-year basis. However, core OTA EBITDA increased 0.9% from the year-ago quarter.
On a sequential basis Core OTA, Egencia and Home Away EBITDA were down 27.1%, 5% and 75.4%, respectively. However, trivago EBITDA increased 12.5% in the reported quarter.
Operating expenses, as percentage of revenues, were 65.1% compared with 51.2% in the previous quarter and 62.5% in the year-ago quarter. The year over year and sequential increase can be attributed to higher adjusted selling and marketing expenses.
Balance Sheet & Cash Flow
As of Dec 31, 2017, cash and short-term investments totaled $3.38 billion, down from $3.83 billion as of Sep 30, 2017. The total debt balance was $4.25 billion compared with net debt of $4.24 billion in the previous quarter.
During 2017, Expedia generated nearly $1.1 billion in free cash flow.
Expedia repurchased nearly 1.3 million shares for a total of $156 million.
Guidance
Expedia forecasts 2018 adjusted EBITDA growth in the range of 6-11%, most of which is expected to come in the second half of the year.
For the first quarter, management expects adjusted EBITDA to decline significantly on a year-over-year basis. Both HomeAway and trivago are projected to report adjusted loss. Continuing investments on accelerated supply acquisition and cloud migration as well as incremental spending on selling & marketing are expected to hurt profits.
Expedia expects cost of revenues to grow slightly faster than revenues. Management also expects technology and content expense to grow significantly faster than revenues, primarily due to an increase in cloud and the impact of key investments.
Expedia expects cloud spending of $170 million for 2018.
How Have Estimates Been Moving Since Then?
It turns out, fresh estimates have trended downward during the past month. There have been six revisions lower for the current quarter. In the past month, the consensus estimate has shifted downward by 221.8% due to these changes.
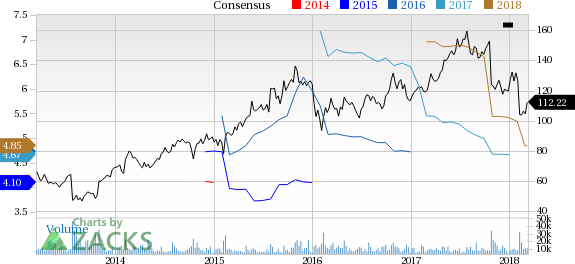
Expedia, Inc. Price and Consensus
Expedia, Inc. Price and Consensus | Expedia, Inc. Quote
VGM Scores
At this time, EXPE has a poor Growth Score of F, however its momentum is doing a lot better with a C. Charting a somewhat similar path, the stock was allocated a grade of D on the value side, putting it in the bottom 40% for this investment strategy.
Overall, the stock has an aggregte VGM Score of F. If you aren't focused on one strategy, this score is the one you should be interested in.
The company's stock is suitable solely for momentum based on our styles scores.
Outlook
Estimates have been broadly trending downward for the stock and the magnitude of these revisions indicates a downward shift. It's no surprise EXPE has a Zacks Rank #5 (Strong Sell). We expect a below average return from the stock in the next few months.
Want the latest recommendations from Zacks Investment Research? Today, you can download 7 Best Stocks for the Next 30 Days. Click to get this free report
Expedia, Inc. (EXPE) : Free Stock Analysis Report
To read this article on Zacks.com click here.
Zacks Investment Research
