
 Yahoo Finance
 Why Ryman Healthcare Limited's (NZSE:RYM) High P/E Ratio Isn't Necessarily A Bad Thing

This article is written for those who want to get better at using price to earnings ratios (P/E ratios). To keep it practical, we'll show how Ryman Healthcare Limited's (NZSE:RYM) P/E ratio could help you assess the value on offer. Ryman Healthcare has a P/E ratio of 24.64, based on the last twelve months. That corresponds to an earnings yield of approximately 4.1%.
See our latest analysis for Ryman Healthcare
How Do I Calculate A Price To Earnings Ratio?
The formula for P/E is:
Price to Earnings Ratio = Share Price ÷ Earnings per Share (EPS)
Or for Ryman Healthcare:
P/E of 24.64 = NZ$16.99 ÷ NZ$0.69 (Based on the year to September 2019.)
Is A High P/E Ratio Good?
The higher the P/E ratio, the higher the price tag of a business, relative to its trailing earnings. That isn't a good or a bad thing on its own, but a high P/E means that buyers have a higher opinion of the business's prospects, relative to stocks with a lower P/E.
Does Ryman Healthcare Have A Relatively High Or Low P/E For Its Industry?
One good way to get a quick read on what market participants expect of a company is to look at its P/E ratio. You can see in the image below that the average P/E (17.8) for companies in the healthcare industry is lower than Ryman Healthcare's P/E.
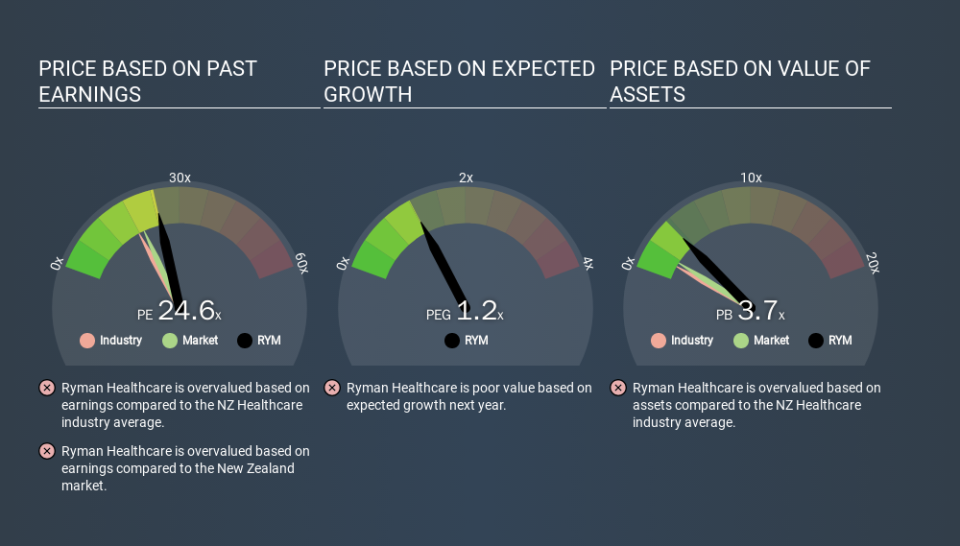
That means that the market expects Ryman Healthcare will outperform other companies in its industry. The market is optimistic about the future, but that doesn't guarantee future growth. So investors should delve deeper. I like to check if company insiders have been buying or selling.
How Growth Rates Impact P/E Ratios
When earnings fall, the 'E' decreases, over time. Therefore, even if you pay a low multiple of earnings now, that multiple will become higher in the future. A higher P/E should indicate the stock is expensive relative to others -- and that may encourage shareholders to sell.
Ryman Healthcare saw earnings per share decrease by 2.9% last year. But it has grown its earnings per share by 9.0% per year over the last five years. And EPS is down 1.4% a year, over the last 3 years. So you wouldn't expect a very high P/E.
Don't Forget: The P/E Does Not Account For Debt or Bank Deposits
Don't forget that the P/E ratio considers market capitalization. In other words, it does not consider any debt or cash that the company may have on the balance sheet. The exact same company would hypothetically deserve a higher P/E ratio if it had a strong balance sheet, than if it had a weak one with lots of debt, because a cashed up company can spend on growth.
Spending on growth might be good or bad a few years later, but the point is that the P/E ratio does not account for the option (or lack thereof).
Is Debt Impacting Ryman Healthcare's P/E?
Ryman Healthcare has net debt worth 18% of its market capitalization. That's enough debt to impact the P/E ratio a little; so keep it in mind if you're comparing it to companies without debt.
The Bottom Line On Ryman Healthcare's P/E Ratio
Ryman Healthcare has a P/E of 24.6. That's higher than the average in its market, which is 19.4. With modest debt but no EPS growth in the last year, it's fair to say the P/E implies some optimism about future earnings, from the market.
Investors should be looking to buy stocks that the market is wrong about. People often underestimate remarkable growth -- so investors can make money when fast growth is not fully appreciated. So this free visual report on analyst forecasts could hold the key to an excellent investment decision.
You might be able to find a better buy than Ryman Healthcare. If you want a selection of possible winners, check out this free list of interesting companies that trade on a P/E below 20 (but have proven they can grow earnings).
If you spot an error that warrants correction, please contact the editor at editorial-team@simplywallst.com. This article by Simply Wall St is general in nature. It does not constitute a recommendation to buy or sell any stock, and does not take account of your objectives, or your financial situation. Simply Wall St has no position in the stocks mentioned.
We aim to bring you long-term focused research analysis driven by fundamental data. Note that our analysis may not factor in the latest price-sensitive company announcements or qualitative material. Thank you for reading.
