
 Yahoo Finance
 Why Scales Corporation Limited (NZSE:SCL) Looks Like A Quality Company

Want to participate in a short research study? Help shape the future of investing tools and you could win a $250 gift card!
Many investors are still learning about the various metrics that can be useful when analysing a stock. This article is for those who would like to learn about Return On Equity (ROE). We'll use ROE to examine Scales Corporation Limited (NZSE:SCL), by way of a worked example.
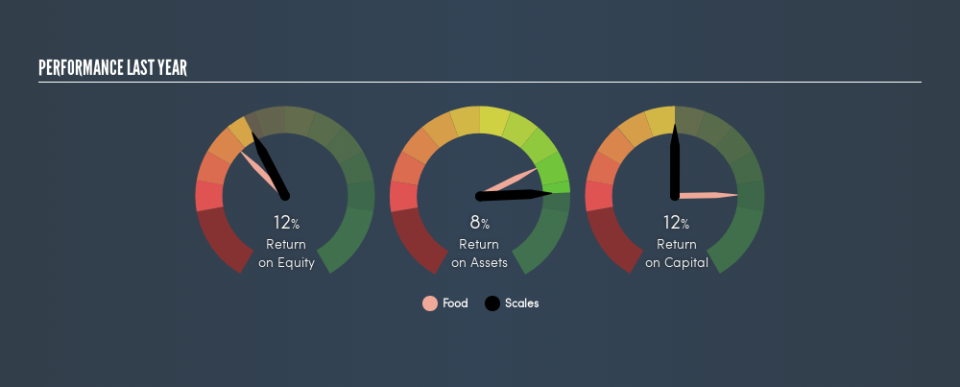
Scales has a ROE of 12%, based on the last twelve months. Another way to think of that is that for every NZ$1 worth of equity in the company, it was able to earn NZ$0.12.
Check out our latest analysis for Scales
How Do I Calculate ROE?
The formula for ROE is:
Return on Equity = Net Profit ÷ Shareholders' Equity
Or for Scales:
12% = NZ$29m ÷ NZ$250m (Based on the trailing twelve months to December 2018.)
Most know that net profit is the total earnings after all expenses, but the concept of shareholders' equity is a little more complicated. It is all earnings retained by the company, plus any capital paid in by shareholders. You can calculate shareholders' equity by subtracting the company's total liabilities from its total assets.
What Does ROE Signify?
ROE measures a company's profitability against the profit it retains, and any outside investments. The 'return' is the yearly profit. A higher profit will lead to a higher ROE. So, as a general rule, a high ROE is a good thing. Clearly, then, one can use ROE to compare different companies.
Does Scales Have A Good Return On Equity?
By comparing a company's ROE with its industry average, we can get a quick measure of how good it is. Importantly, this is far from a perfect measure, because companies differ significantly within the same industry classification. Pleasingly, Scales has a superior ROE than the average (8.8%) company in the Food industry.
That's clearly a positive. In my book, a high ROE almost always warrants a closer look. One data point to check is if insiders have bought shares recently.
The Importance Of Debt To Return On Equity
Companies usually need to invest money to grow their profits. That cash can come from issuing shares, retained earnings, or debt. In the case of the first and second options, the ROE will reflect this use of cash, for growth. In the latter case, the debt used for growth will improve returns, but won't affect the total equity. That will make the ROE look better than if no debt was used.
Scales's Debt And Its 12% ROE
Scales has a debt to equity ratio of 0.29, which is far from excessive. The fact that it achieved a fairly good ROE with only modest debt suggests the business might be worth putting on your watchlist. Careful use of debt to boost returns is often very good for shareholders. However, it could reduce the company's ability to take advantage of future opportunities.
The Key Takeaway
Return on equity is useful for comparing the quality of different businesses. In my book the highest quality companies have high return on equity, despite low debt. If two companies have the same ROE, then I would generally prefer the one with less debt.
But ROE is just one piece of a bigger puzzle, since high quality businesses often trade on high multiples of earnings. Profit growth rates, versus the expectations reflected in the price of the stock, are a particularly important to consider. So I think it may be worth checking this free report on analyst forecasts for the company.
Of course, you might find a fantastic investment by looking elsewhere. So take a peek at this free list of interesting companies.
We aim to bring you long-term focused research analysis driven by fundamental data. Note that our analysis may not factor in the latest price-sensitive company announcements or qualitative material.
If you spot an error that warrants correction, please contact the editor at editorial-team@simplywallst.com. This article by Simply Wall St is general in nature. It does not constitute a recommendation to buy or sell any stock, and does not take account of your objectives, or your financial situation. Simply Wall St has no position in the stocks mentioned. Thank you for reading.
