
 Yahoo Finance
 Williams-Sonoma (WSM) Rallies on Q4 Earnings & Revenue Beat

Shares of Williams-Sonoma Inc. WSM rallied more than 5% in after-hours trading on Mar 14, after the company reported better-than-expected results in the fourth quarter of fiscal 2017.
Adjusted earnings of $1.68 per share surpassed the Zacks Consensus Estimate of $1.63. The figure also increased 8.4% from the year-ago level.
Revenue Discussion
Net revenues of $1,680 million came ahead of the consensus mark of $1,649 million and increased 6.2% year over year.
Comparable brand revenues increased 5.4% in the quarter, better than 3.3% increase in the preceding quarter and 0.9% decline in the year-ago quarter. The reported figure marks the highest fourth-quarter comps the company has registered in several years, driven by broad-based strength across all its brands. All brands of Williams-Sonoma have returned to positive growth this quarter.
The company’s namesake brand’s comparable brand revenues were up 4.3%, better than 1.4% growth in the prior-year quarter. West Elm’s comparable brand revenues increased 12.3% compared with a 6.5% rise in the prior-year quarter.
Pottery Barn’s comparable brand revenues were up 4.1% against a 4.1% decline in the prior-year quarter. Pottery Barn Kids’ comparable brand revenues increased 0.9% against 4.9% decline in the year-ago quarter. PBteen’s comparable brand revenues registered 2.6% growth against 8.1% plunge in the year-ago quarter.
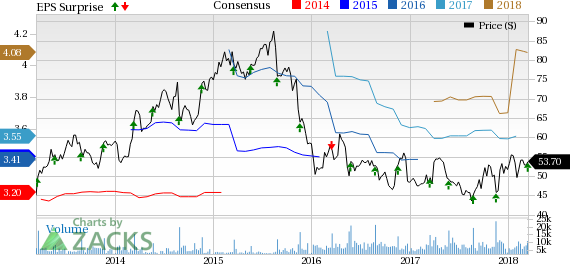
Williams-Sonoma, Inc. Price, Consensus and EPS Surprise
Williams-Sonoma, Inc. Price, Consensus and EPS Surprise | Williams-Sonoma, Inc. Quote
Segment Details
e-commerce (accounting for 52.5% of fiscal 2017 revenues): The segment reported net revenues of $877 million in the quarter, up 8.4% year over year.
Retail (47.5%): The segment reported net revenues of $802 million in the reported quarter, up 3.9% from the prior-year quarter.
Operating Highlights
Non-GAAP operating margin was 12.4% in the quarter, down 120 basis points (bps) from the year-ago quarter. Gross margin was 38.5%, down 80 bps from the year-ago figure.
Adjusted selling, general and administrative (SG&A) expenses were 26.1% of net revenues or $438 million in the quarter, reflecting an increase of 40 bps year over year due to higher digital advertising spending and employment-related costs.
Merchandise inventories at the end of the quarter increased 8.6% to $1.06 billion from the prior-year quarter.
Fiscal 2017 Highlights
Full-year adjusted earnings came in at $3.61, up 5.2% year over year. Net revenues were $5.3 billion, an increase of 4.1% from fiscal 2016 level. Comparable brand revenues grew 3.2%, marking a major improvement from 0.7% growth in fiscal 2016. West Elm registered the highest growth in Comparable brand revenues (up 10.2%), followed by Williams Sonoma (3.2%), and Pottery Barn (1%). However, Pottery Barn Kids and PBteen registered a decline of 1.8% and 1.4%, respectively, in comparable brand revenues.
Financials
Williams-Sonoma had cash and cash equivalents of $390.1 million as of Jan 28, 2018, compared with $213.7 million as of Jan 29, 2017.
During fiscal 2017, the company repurchased 4.1 million shares of common stock at an average cost of $48.43 per share and a total cost of approximately $196 million. Williams-Sonoma has approximately $214 million remaining under its present stock repurchase authorization, as of Jan 28, 2018.
10% Dividend Hike
Separately, the company’s board of directors authorized a 10% increase in its quarterly cash dividend to 43 cents per share. The company also raised its share buyback authorization to $500 million.
Fiscal First-Quarter Guidance
Williams-Sonoma expects non-GAAP earnings per share for the first quarter in the band of 55-60 cents.
The company expects net revenues in the band of $1,135-$1,170 million. Comparable brand revenues are likely to grow 2-5%.
Fiscal 2018 Guidance
The company expects revenues in the $5,475-$5,635 million range. Comparable brand revenues are likely to grow in the 2-5% range.
Williams-Sonoma expects non-GAAP earnings in the range of $4.12-$4.22 per share.
Non-GAAP operating margin is anticipated in the 8.2-9% range and tax rate between 24% and 26%.
Capital expenditures are projected in the $200-$220 million range for the year.
Zacks Rank & Stocks to Consider
Williams-Sonoma carries a Zacks Rank #3 (Hold).
A few better-ranked stocks in the Retail-Wholesale sector are Dillard's, Inc. DDS, Macy's, Inc. M and Kohl's Corporation KSS.
Earnings for Dillard's, a Zacks Rank #1 (Strong Buy) company, are expected to increase 21.3% this year. You can see the complete list of today’s Zacks #1 Rank stocks here.
Macy's has a solid ROE of 24.9%, higher the industry average of 11.2%. The company also sports a Zacks Rank #1.
Earnings for Kohl's, a Zacks Rank #2 (Buy) stock, are expected to increase 24.1% this year.
Can Hackers Put Money INTO Your Portfolio?
Earlier this month, credit bureau Equifax announced a massive data breach affecting 2 out of every 3 Americans. The cybersecurity industry is expanding quickly in response to this and similar events. But some stocks are better investments than others.
Zacks has just released Cybersecurity! An Investor’s Guide to help Zacks.com readers make the most of the $170 billion per year investment opportunity created by hackers and other threats. It reveals 4 stocks worth looking into right away.
Download the new report now>>
Want the latest recommendations from Zacks Investment Research? Today, you can download 7 Best Stocks for the Next 30 Days. Click to get this free report
Williams-Sonoma, Inc. (WSM) : Free Stock Analysis Report
Macy's Inc (M) : Free Stock Analysis Report
Dillard's, Inc. (DDS) : Free Stock Analysis Report
Kohl's Corporation (KSS) : Free Stock Analysis Report
To read this article on Zacks.com click here.
Zacks Investment Research
