
 Yahoo Finance
 The Worldwide Virtual Training and Simulation Industry is Expected to Reach $565 Billion by 2027

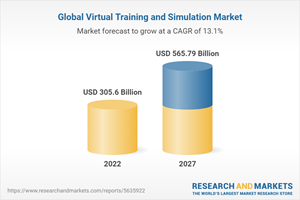
Global Virtual Training and Simulation Market
Dublin, Sept. 01, 2022 (GLOBE NEWSWIRE) -- The "Global Virtual Training and Simulation Market (2022-2027) by Component, End-user, Geography, Competitive Analysis and the Impact of Covid-19 with Ansoff Analysis" report has been added to ResearchAndMarkets.com's offering.
The Global Virtual Training and Simulation Market is estimated to be USD 305.6 Bn in 2022 and is expected to reach USD 565.79 Bn by 2027, growing at a CAGR of 13.11%.
Market Dynamics
Market dynamics are forces that impact the prices and behaviors of the Global Virtual Training and Simulation Market stakeholders. These forces create pricing signals which result from the changes in the supply and demand curves for a given product or service. Forces of Market Dynamics may be related to macro-economic and micro-economic factors.
There are dynamic market forces other than price, demand, and supply. Human emotions can also drive decisions, influence the market, and create price signals. As the market dynamics impact the supply and demand curves, decision-makers aim to determine the best way to use various financial tools to stem various strategies for speeding the growth and reducing the risks.
Company Profiles
The report provides a detailed analysis of the competitors in the market. It covers the financial performance analysis for the publicly listed companies in the market. The report also offers detailed information on the companies' recent development and competitive scenario. Some of the companies covered in this report are Raytheon Technologies, Lockheed Martin, CAE, Saab, Rheinmetall, Bae Systems, St Engineering, The Boeing Company, Northrop Grumman, etc.
Countries Studied
America (Argentina, Brazil, Canada, Chile, Colombia, Mexico, Peru, United States, Rest of Americas)
Europe (Austria, Belgium, Denmark, Finland, France, Germany, Italy, Netherlands, Norway, Poland, Russia, Spain, Sweden, Switzerland, United Kingdom, Rest of Europe)
Middle-East and Africa (Egypt, Israel, Qatar, Saudi Arabia, South Africa, United Arab Emirates, Rest of MEA)
Asia-Pacific (Australia, Bangladesh, China, India, Indonesia, Japan, Malaysia, Philippines, Singapore, South Korea, Sri Lanka, Thailand, Taiwan, Rest of Asia-Pacific)
Competitive Quadrant
The report includes Competitive Quadrant, a proprietary tool to analyze and evaluate the position of companies based on their Industry Position score and Market Performance score. The tool uses various factors for categorizing the players into four categories. Some of these factors considered for analysis are financial performance over the last 3 years, growth strategies, innovation score, new product launches, investments, growth in market share, etc.
Ansoff Analysis
The report presents a detailed Ansoff matrix analysis for the Global Virtual Training and Simulation Market. Ansoff Matrix, also known as Product/Market Expansion Grid, is a strategic tool used to design strategies for the growth of the company. The matrix can be used to evaluate approaches in four strategies viz. Market Development, Market Penetration, Product Development and Diversification. The matrix is also used for risk analysis to understand the risk involved with each approach. The analyst analyses the using the Ansoff Matrix to provide the best approaches a company can take to improve its market position. Based on the SWOT analysis conducted on the industry and industry players, the analyst has devised suitable strategies for market growth.
Why buy this report?
The report offers a comprehensive evaluation of the Global Virtual Training and Simulation Market. The report includes in-depth qualitative analysis, verifiable data from authentic sources, and projections about market size. The projections are calculated using proven research methodologies.
The report has been compiled through extensive primary and secondary research. The primary research is done through interviews, surveys, and observation of renowned personnel in the industry.
The report includes an in-depth market analysis using Porter's 5 forces model and the Ansoff Matrix. In addition, the impact of Covid-19 on the market is also featured in the report.
The report also includes the regulatory scenario in the industry, which will help you make a well-informed decision. The report discusses major regulatory bodies and major rules and regulations imposed on this sector across various geographies.
The report also contains the competitive analysis using Positioning Quadrants, the analyst's Proprietary competitive positioning tool.
Key Topics Covered:
1 Report Description
2 Research Methodology
3 Executive Summary
4 Market Dynamics
4.1 Drivers
4.1.1 Increase in Awareness about Virtual Training and Simulation
4.1.2 Cost-Effective Benefits of Virtual Training and Simulation Solutions
4.1.3 Increase in Defense, Healthcare, and Education Expenditure
4.2 Restraints
4.2.1 Resistance to Adopt the Virtual Training and Simulation Technology
4.3 Opportunities
4.3.1 Advancements in Technology
4.3.2 Scope for Improvements in Other Industries (Mining, Transportation, and Energy)
4.4 Challenges
4.4.1 Lack of R&D Investments
5 Market Analysis
5.1 Regulatory Scenario
5.2 Porter's Five Forces Analysis
5.3 Impact of COVID-19
5.4 Ansoff Matrix Analysis
6 Global Virtual Training and Simulation Market, By Component
6.1 Introduction
6.2 Hardware
6.3 Software
7 Global Virtual Training and Simulation Market, By End-user
7.1 Introduction
7.2 Defense & Security
7.3 Civil Aviation
7.4 Education
7.5 Entertainment
8 Americas' Virtual Training and Simulation Market
8.1 Introduction
8.2 Argentina
8.3 Brazil
8.4 Canada
8.5 Chile
8.6 Colombia
8.7 Mexico
8.8 Peru
8.9 United States
8.10 Rest of Americas
9 Europe's Virtual Training and Simulation Market
9.1 Introduction
9.2 Austria
9.3 Belgium
9.4 Denmark
9.5 Finland
9.6 France
9.7 Germany
9.8 Italy
9.9 Netherlands
9.10 Norway
9.11 Poland
9.12 Russia
9.13 Spain
9.14 Sweden
9.15 Switzerland
9.16 United Kingdom
9.17 Rest of Europe
10 Middle East and Africa's Virtual Training and Simulation Market
10.1 Introduction
10.2 Egypt
10.3 Israel
10.4 Qatar
10.5 Saudi Arabia
10.6 South Africa
10.7 United Arab Emirates
10.8 Rest of MEA
11 APAC's Virtual Training and Simulation Market
11.1 Introduction
11.2 Australia
11.3 Bangladesh
11.4 China
11.5 India
11.6 Indonesia
11.7 Japan
11.8 Malaysia
11.9 Philippines
11.10 Singapore
11.11 South Korea
11.12 Sri Lanka
11.13 Thailand
11.14 Taiwan
11.15 Rest of Asia-Pacific
12 Competitive Landscape
12.1 Competitive Quadrant
12.2 Market Share Analysis
12.3 Strategic Initiatives
12.3.1 M&A and Investments
12.3.2 Partnerships and Collaborations
12.3.3 Product Developments and Improvements
13 Company Profiles
13.1 Avion Group
13.2 AVT Simulation
13.3 BAE Systems
13.4 Bohemia Interactive Simulations
13.5 Booz Allen Hamilton
13.6 CAE
13.7 Cubic
13.8 ECA Group
13.9 Elbit Systems
13.10 Frasca International
13.11 Indra Sistemas
13.12 Inveris Training Solutions
13.13 Kongsberg Maritime
13.14 Leonardo
13.15 Lockheed Martin
13.16 Northrop Grumman
13.17 Precision Flight Controls
13.18 Raytheon Technologies
13.19 Rheinmetall
13.20 SAAB
13.21 ST Engineering
13.22 Textron
13.23 Thales
13.24 The Boeing Company
13.25 Virtra
13.26 Vstep
14 Appendix
For more information about this report visit https://www.researchandmarkets.com/r/fflvhj
Attachment
CONTACT: CONTACT: ResearchAndMarkets.com Laura Wood, Senior Press Manager press@researchandmarkets.com For E.S.T Office Hours Call 1-917-300-0470 For U.S./CAN Toll Free Call 1-800-526-8630 For GMT Office Hours Call +353-1-416-8900

