
 Yahoo Finance
 Should We Worry About The New Zealand Refining Company Limited's (NZSE:NZR) P/E Ratio?

Want to participate in a short research study? Help shape the future of investing tools and you could win a $250 gift card!
Today, we'll introduce the concept of the P/E ratio for those who are learning about investing. We'll show how you can use The New Zealand Refining Company Limited's (NZSE:NZR) P/E ratio to inform your assessment of the investment opportunity. New Zealand Refining has a P/E ratio of 21.82, based on the last twelve months. That corresponds to an earnings yield of approximately 4.6%.
Check out our latest analysis for New Zealand Refining
How Do I Calculate A Price To Earnings Ratio?
The formula for P/E is:
Price to Earnings Ratio = Share Price ÷ Earnings per Share (EPS)
Or for New Zealand Refining:
P/E of 21.82 = NZ$2.07 ÷ NZ$0.095 (Based on the year to December 2018.)
Is A High P/E Ratio Good?
The higher the P/E ratio, the higher the price tag of a business, relative to its trailing earnings. That is not a good or a bad thing per se, but a high P/E does imply buyers are optimistic about the future.
How Growth Rates Impact P/E Ratios
If earnings fall then in the future the 'E' will be lower. That means unless the share price falls, the P/E will increase in a few years. Then, a higher P/E might scare off shareholders, pushing the share price down.
New Zealand Refining shrunk earnings per share by 62% over the last year. And it has shrunk its earnings per share by 42% per year over the last three years. This could justify a low P/E.
How Does New Zealand Refining's P/E Ratio Compare To Its Peers?
One good way to get a quick read on what market participants expect of a company is to look at its P/E ratio. The image below shows that New Zealand Refining has a higher P/E than the average (10) P/E for companies in the oil and gas industry.
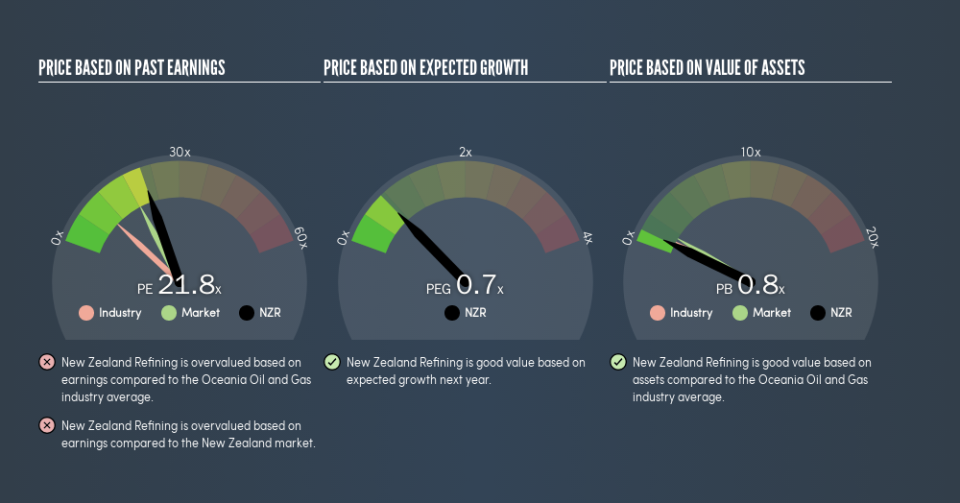
New Zealand Refining's P/E tells us that market participants think the company will perform better than its industry peers, going forward. Shareholders are clearly optimistic, but the future is always uncertain. So investors should delve deeper. I like to check if company insiders have been buying or selling.
Don't Forget: The P/E Does Not Account For Debt or Bank Deposits
The 'Price' in P/E reflects the market capitalization of the company. Thus, the metric does not reflect cash or debt held by the company. The exact same company would hypothetically deserve a higher P/E ratio if it had a strong balance sheet, than if it had a weak one with lots of debt, because a cashed up company can spend on growth.
While growth expenditure doesn't always pay off, the point is that it is a good option to have; but one that the P/E ratio ignores.
New Zealand Refining's Balance Sheet
Net debt is 41% of New Zealand Refining's market cap. You'd want to be aware of this fact, but it doesn't bother us.
The Verdict On New Zealand Refining's P/E Ratio
New Zealand Refining has a P/E of 21.8. That's higher than the average in the NZ market, which is 18.3. With a bit of debt, but a lack of recent growth, it's safe to say the market is expecting improved profit performance from the company, in the next few years.
When the market is wrong about a stock, it gives savvy investors an opportunity. If the reality for a company is better than it expects, you can make money by buying and holding for the long term. So this free visual report on analyst forecasts could hold the key to an excellent investment decision.
Of course, you might find a fantastic investment by looking at a few good candidates. So take a peek at this free list of companies with modest (or no) debt, trading on a P/E below 20.
We aim to bring you long-term focused research analysis driven by fundamental data. Note that our analysis may not factor in the latest price-sensitive company announcements or qualitative material.
If you spot an error that warrants correction, please contact the editor at editorial-team@simplywallst.com. This article by Simply Wall St is general in nature. It does not constitute a recommendation to buy or sell any stock, and does not take account of your objectives, or your financial situation. Simply Wall St has no position in the stocks mentioned. Thank you for reading.
