
 Yahoo Finance
 Worthington Industries' (NYSE:WOR) 18% CAGR outpaced the company's earnings growth over the same three-year period
By buying an index fund, investors can approximate the average market return. But if you buy good businesses at attractive prices, your portfolio returns could exceed the average market return. For example, the Worthington Industries, Inc. (NYSE:WOR) share price is up 52% in the last three years, clearly besting the market return of around 24% (not including dividends). However, more recent returns haven't been as impressive as that, with the stock returning just 5.3% in the last year , including dividends .
The past week has proven to be lucrative for Worthington Industries investors, so let's see if fundamentals drove the company's three-year performance.
Check out our latest analysis for Worthington Industries
To quote Buffett, 'Ships will sail around the world but the Flat Earth Society will flourish. There will continue to be wide discrepancies between price and value in the marketplace...' One way to examine how market sentiment has changed over time is to look at the interaction between a company's share price and its earnings per share (EPS).
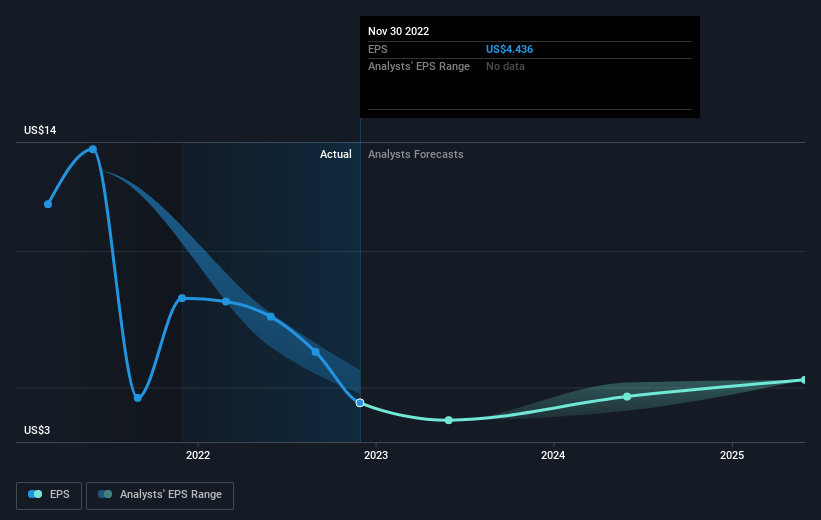
Worthington Industries was able to grow its EPS at 30% per year over three years, sending the share price higher. This EPS growth is higher than the 15% average annual increase in the share price. So one could reasonably conclude that the market has cooled on the stock.
You can see below how EPS has changed over time (discover the exact values by clicking on the image).
We like that insiders have been buying shares in the last twelve months. Even so, future earnings will be far more important to whether current shareholders make money. Dive deeper into the earnings by checking this interactive graph of Worthington Industries' earnings, revenue and cash flow.
What About Dividends?
As well as measuring the share price return, investors should also consider the total shareholder return (TSR). The TSR is a return calculation that accounts for the value of cash dividends (assuming that any dividend received was reinvested) and the calculated value of any discounted capital raisings and spin-offs. Arguably, the TSR gives a more comprehensive picture of the return generated by a stock. We note that for Worthington Industries the TSR over the last 3 years was 63%, which is better than the share price return mentioned above. The dividends paid by the company have thusly boosted the total shareholder return.
A Different Perspective
We're pleased to report that Worthington Industries shareholders have received a total shareholder return of 5.3% over one year. That's including the dividend. Having said that, the five-year TSR of 7% a year, is even better. It's always interesting to track share price performance over the longer term. But to understand Worthington Industries better, we need to consider many other factors. Even so, be aware that Worthington Industries is showing 1 warning sign in our investment analysis , you should know about...
There are plenty of other companies that have insiders buying up shares. You probably do not want to miss this free list of growing companies that insiders are buying.
Please note, the market returns quoted in this article reflect the market weighted average returns of stocks that currently trade on US exchanges.
Have feedback on this article? Concerned about the content? Get in touch with us directly. Alternatively, email editorial-team (at) simplywallst.com.
This article by Simply Wall St is general in nature. We provide commentary based on historical data and analyst forecasts only using an unbiased methodology and our articles are not intended to be financial advice. It does not constitute a recommendation to buy or sell any stock, and does not take account of your objectives, or your financial situation. We aim to bring you long-term focused analysis driven by fundamental data. Note that our analysis may not factor in the latest price-sensitive company announcements or qualitative material. Simply Wall St has no position in any stocks mentioned.
Join A Paid User Research Session
You’ll receive a US$30 Amazon Gift card for 1 hour of your time while helping us build better investing tools for the individual investors like yourself. Sign up here
