
 Yahoo Finance
 XOMA (NASDAQ:XOMA) shareholders have endured a 39% loss from investing in the stock five years ago
XOMA Corporation (NASDAQ:XOMA) shareholders should be happy to see the share price up 14% in the last month. But over the last half decade, the stock has not performed well. After all, the share price is down 39% in that time, significantly under-performing the market.
It's worthwhile assessing if the company's economics have been moving in lockstep with these underwhelming shareholder returns, or if there is some disparity between the two. So let's do just that.
View our latest analysis for XOMA
While markets are a powerful pricing mechanism, share prices reflect investor sentiment, not just underlying business performance. One imperfect but simple way to consider how the market perception of a company has shifted is to compare the change in the earnings per share (EPS) with the share price movement.
During five years of share price growth, XOMA moved from a loss to profitability. Most would consider that to be a good thing, so it's counter-intuitive to see the share price declining. Other metrics might give us a better handle on how its value is changing over time.
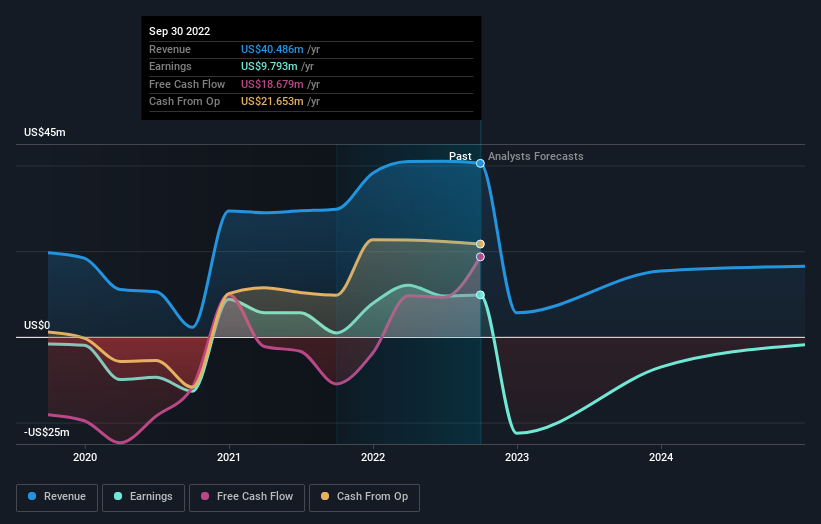
In contrast to the share price, revenue has actually increased by 0.04% a year in the five year period. A more detailed examination of the revenue and earnings may or may not explain why the share price languishes; there could be an opportunity.
The image below shows how earnings and revenue have tracked over time (if you click on the image you can see greater detail).
It is of course excellent to see how XOMA has grown profits over the years, but the future is more important for shareholders. You can see how its balance sheet has strengthened (or weakened) over time in this free interactive graphic.
A Different Perspective
While it's never nice to take a loss, XOMA shareholders can take comfort that their trailing twelve month loss of 12% wasn't as bad as the market loss of around 19%. Given the total loss of 7% per year over five years, it seems returns have deteriorated in the last twelve months. Whilst Baron Rothschild does tell the investor "buy when there's blood in the streets, even if the blood is your own", buyers would need to examine the data carefully to be comfortable that the business itself is sound. Before deciding if you like the current share price, check how XOMA scores on these 3 valuation metrics.
If you like to buy stocks alongside management, then you might just love this free list of companies. (Hint: insiders have been buying them).
Please note, the market returns quoted in this article reflect the market weighted average returns of stocks that currently trade on US exchanges.
Have feedback on this article? Concerned about the content? Get in touch with us directly. Alternatively, email editorial-team (at) simplywallst.com.
This article by Simply Wall St is general in nature. We provide commentary based on historical data and analyst forecasts only using an unbiased methodology and our articles are not intended to be financial advice. It does not constitute a recommendation to buy or sell any stock, and does not take account of your objectives, or your financial situation. We aim to bring you long-term focused analysis driven by fundamental data. Note that our analysis may not factor in the latest price-sensitive company announcements or qualitative material. Simply Wall St has no position in any stocks mentioned.
Join A Paid User Research Session
You’ll receive a US$30 Amazon Gift card for 1 hour of your time while helping us build better investing tools for the individual investors like yourself. Sign up here
