
 Yahoo Finance
 Is Yandex N.V. (NASDAQ:YNDX) Investing Your Capital Efficiently?

Today we’ll evaluate Yandex N.V. (NASDAQ:YNDX) to determine whether it could have potential as an investment idea. To be precise, we’ll consider its Return On Capital Employed (ROCE), as that will inform our view of the quality of the business.
Firstly, we’ll go over how we calculate ROCE. Then we’ll compare its ROCE to similar companies. Then we’ll determine how its current liabilities are affecting its ROCE.
What is Return On Capital Employed (ROCE)?
ROCE measures the amount of pre-tax profits a company can generate from the capital employed in its business. All else being equal, a better business will have a higher ROCE. Overall, it is a valuable metric that has its flaws. Author Edwin Whiting says to be careful when comparing the ROCE of different businesses, since ‘No two businesses are exactly alike.’
So, How Do We Calculate ROCE?
The formula for calculating the return on capital employed is:
Return on Capital Employed = Earnings Before Interest and Tax (EBIT) ÷ (Total Assets – Current Liabilities)
Or for Yandex:
0.087 = RUруб13b ÷ (RUруб253b – RUруб43b) (Based on the trailing twelve months to September 2018.)
Therefore, Yandex has an ROCE of 8.7%.
Check out our latest analysis for Yandex
Want to help shape the future of investing tools and platforms? Take the survey and be part of one of the most advanced studies of stock market investors to date.
Does Yandex Have A Good ROCE?
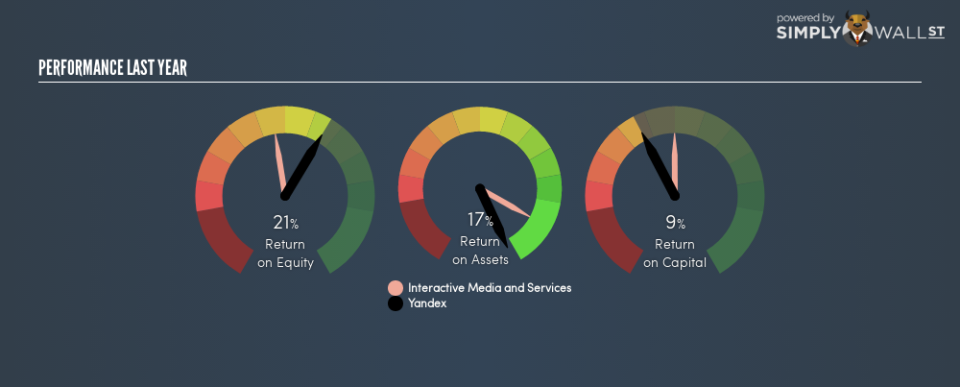
One way to assess ROCE is to compare similar companies. It appears that Yandex’s ROCE is fairly close to the Interactive Media and Services industry average of 10%. Separate from how Yandex stacks up against its industry, its ROCE in absolute terms is mediocre; relative to the returns on government bonds. Readers may find more attractive investment prospects elsewhere.
Yandex’s current ROCE of 8.7% is lower than its ROCE in the past, which was 12%, 3 years ago. This makes us wonder if the business is facing new challenges.
Remember that this metric is backwards looking – it shows what has happened in the past, and does not accurately predict the future. ROCE can be deceptive for cyclical businesses, as returns can look incredible in boom times, and terribly low in downturns. This is because ROCE only looks at one year, instead of considering returns across a whole cycle. Future performance is what matters, and you can see analyst predictions in our free report on analyst forecasts for the company.
Yandex’s Current Liabilities And Their Impact On Its ROCE
Current liabilities include invoices, such as supplier payments, short-term debt, or a tax bill, that need to be paid within 12 months. The ROCE equation subtracts current liabilities from capital employed, so a company with a lot of current liabilities appears to have less capital employed, and a higher ROCE than otherwise. To counteract this, we check if a company has high current liabilities, relative to its total assets.
Yandex has total liabilities of RUруб43b and total assets of RUруб253b. Therefore its current liabilities are equivalent to approximately 17% of its total assets. This very reasonable level of current liabilities would not boost the ROCE by much.
What We Can Learn From Yandex’s ROCE
That said, Yandex’s ROCE is mediocre, there may be more attractive investments around. Of course, you might find a fantastic investment by looking at a few good candidates. So take a peek at this free list of companies with modest (or no) debt, trading on a P/E below 20.
For those who like to find winning investments this free list of growing companies with recent insider purchasing, could be just the ticket.
To help readers see past the short term volatility of the financial market, we aim to bring you a long-term focused research analysis purely driven by fundamental data. Note that our analysis does not factor in the latest price-sensitive company announcements.
The author is an independent contributor and at the time of publication had no position in the stocks mentioned. For errors that warrant correction please contact the editor at editorial-team@simplywallst.com.
