
 Yahoo Finance
 Is Zions Bancorporation (NASDAQ:ZION) Expensive For A Reason? A Look At The Intrinsic Value

Valuing ZION, a bank stock, can be daunting since these financial companies have cash flows that are impacted by regulations that are not imposed upon other industries. For example, banks are required to hold more capital to reduce the risk to depositors. Focusing on factors such as book values, with the return and cost of equity, can be useful for determining ZION’s intrinsic value. Below I’ll look at how to value ZION in a reasonably effective and straightforward approach.
View our latest analysis for Zions Bancorporation
What Is The Excess Return Model?
Let’s keep in mind two things – regulation and type of assets. ZION operates in United States which has stringent financial regulations. In addition, banks tend to not possess significant portions of physical assets on their balance sheet. As traditional valuation models put weight on inputs such as capex and depreciation, which is less meaningful for finacial firms, the Excess Return model places importance on forecasting stable earnings and book values.
Deriving ZION’s True Value
The central assumption for this model is, the value of the company is how much money it can generate from its current level of equity capital, in excess of the cost of that capital. The returns in excess of cost of equity is called excess returns:
Excess Return Per Share = (Stable Return On Equity – Cost Of Equity) (Book Value Of Equity Per Share)
= (11.83% – 10.9%) x $38.66 = $0.34
Excess Return Per Share is used to calculate the terminal value of ZION, which is how much the business is expected to continue to generate over the upcoming years, in perpetuity. This is a common component of discounted cash flow models:
Terminal Value Per Share = Excess Return Per Share / (Cost of Equity – Expected Growth Rate)
= $0.34 / (10.9% – 2.9%) = $4.29
Putting this all together, we get the value of ZION’s share:
Value Per Share = Book Value of Equity Per Share + Terminal Value Per Share
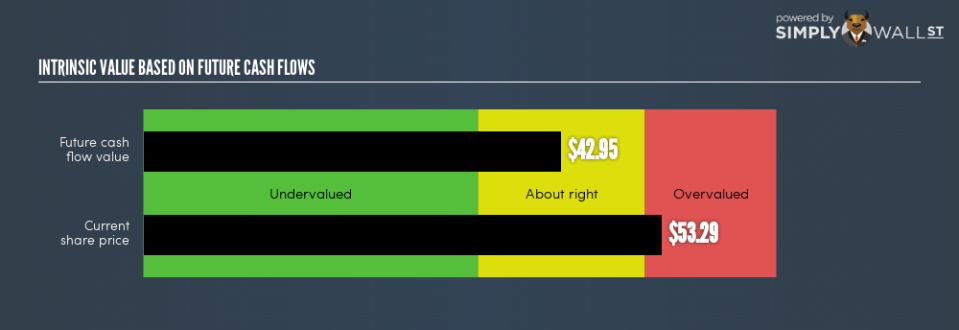
= $38.66 + $4.29 = $42.95
This results in an intrinsic value of $42.95. Given ZION’s current share price of US$53.29, ZION is overvalued. This means ZION isn’t an attractive buy right now. Valuation is only one side of the coin when you’re looking to invest, or sell, ZION. Fundamental factors are key to determining if ZION fits with the rest of your portfolio holdings.
Next Steps:
For banks, there are three key aspects you should look at:
Financial health: Does it have a healthy balance sheet? Take a look at our free bank analysis with six simple checks on things like bad loans and customer deposits.
Future earnings: What does the market think of ZION going forward? Our analyst growth expectation chart helps visualize ZION’s growth potential over the upcoming years.
Dividends: Most people buy financial stocks for their healthy and stable dividends. Check out whether ZION is a dividend Rockstar with our historical and future dividend analysis.
For more details and sources, take a look at our full calculation on ZION here.
To help readers see past the short term volatility of the financial market, we aim to bring you a long-term focused research analysis purely driven by fundamental data. Note that our analysis does not factor in the latest price-sensitive company announcements.
The author is an independent contributor and at the time of publication had no position in the stocks mentioned. For errors that warrant correction please contact the editor at editorial-team@simplywallst.com.
