
 Yahoo Finance
 Delegat Group (NZSE:DGL) investors are sitting on a loss of 54% if they invested three years ago
If you love investing in stocks you're bound to buy some losers. But long term Delegat Group Limited (NZSE:DGL) shareholders have had a particularly rough ride in the last three year. Unfortunately, they have held through a 57% decline in the share price in that time. And over the last year the share price fell 30%, so we doubt many shareholders are delighted.
So let's have a look and see if the longer term performance of the company has been in line with the underlying business' progress.
See our latest analysis for Delegat Group
While markets are a powerful pricing mechanism, share prices reflect investor sentiment, not just underlying business performance. One imperfect but simple way to consider how the market perception of a company has shifted is to compare the change in the earnings per share (EPS) with the share price movement.
Delegat Group saw its EPS decline at a compound rate of 8.3% per year, over the last three years. This reduction in EPS is slower than the 24% annual reduction in the share price. So it's likely that the EPS decline has disappointed the market, leaving investors hesitant to buy. This increased caution is also evident in the rather low P/E ratio, which is sitting at 11.25.
You can see below how EPS has changed over time (discover the exact values by clicking on the image).
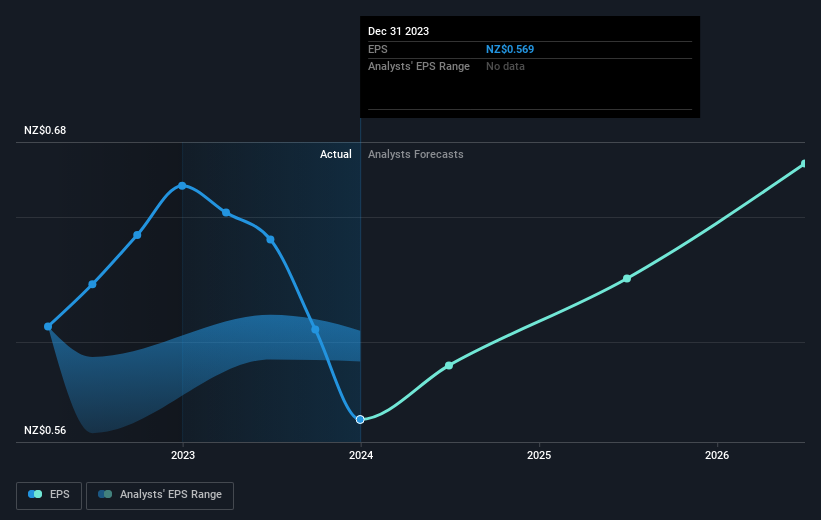
Dive deeper into Delegat Group's key metrics by checking this interactive graph of Delegat Group's earnings, revenue and cash flow.
What About Dividends?
It is important to consider the total shareholder return, as well as the share price return, for any given stock. The TSR incorporates the value of any spin-offs or discounted capital raisings, along with any dividends, based on the assumption that the dividends are reinvested. Arguably, the TSR gives a more comprehensive picture of the return generated by a stock. In the case of Delegat Group, it has a TSR of -54% for the last 3 years. That exceeds its share price return that we previously mentioned. And there's no prize for guessing that the dividend payments largely explain the divergence!
A Different Perspective
While the broader market lost about 0.8% in the twelve months, Delegat Group shareholders did even worse, losing 28% (even including dividends). However, it could simply be that the share price has been impacted by broader market jitters. It might be worth keeping an eye on the fundamentals, in case there's a good opportunity. Regrettably, last year's performance caps off a bad run, with the shareholders facing a total loss of 6% per year over five years. Generally speaking long term share price weakness can be a bad sign, though contrarian investors might want to research the stock in hope of a turnaround. It's always interesting to track share price performance over the longer term. But to understand Delegat Group better, we need to consider many other factors. Take risks, for example - Delegat Group has 1 warning sign we think you should be aware of.
If you are like me, then you will not want to miss this free list of growing companies that insiders are buying.
Please note, the market returns quoted in this article reflect the market weighted average returns of stocks that currently trade on New Zealander exchanges.
Have feedback on this article? Concerned about the content? Get in touch with us directly. Alternatively, email editorial-team (at) simplywallst.com.
This article by Simply Wall St is general in nature. We provide commentary based on historical data and analyst forecasts only using an unbiased methodology and our articles are not intended to be financial advice. It does not constitute a recommendation to buy or sell any stock, and does not take account of your objectives, or your financial situation. We aim to bring you long-term focused analysis driven by fundamental data. Note that our analysis may not factor in the latest price-sensitive company announcements or qualitative material. Simply Wall St has no position in any stocks mentioned.
