
 Yahoo Finance
 Gold Sinks to 8-Month, SPX 500 Rebound Runs Out of Steam
DailyFX.com -
Talking Points:
US Dollar Soars to Highest in 14 Months as Bulls Return in Force
S&P 500 Rebound Stalls, Fails to Overcome September Swing Top
Crude Oil Runs into Resistance, Gold Prices Sink to 8-Month Low
Can’t access the Dow Jones FXCM US Dollar Index? Try the USD basket on Mirror Trader. **
US DOLLAR TECHNICAL ANALYSIS – Prices turned sharply higher anew, putting the benchmark unit at the highest level in 14 months against its top counterparts.Near-term resistance is at 10953, the 23.6% Fibonacci expansion, with a break above that on a daily closing basis exposing the 38.2% level at 11031. Alternatively, a reversal below the 14.6% Fib at 10905 opens the door for a challenge of the September 16 low at 10827.

Daily Chart - Created Using FXCM Marketscope 2.0
** The Dow Jones FXCM US Dollar Index and the Mirror Trader USD basket are not the same product.
S&P 500 TECHNICAL ANALYSIS – Prices recoiled from support at 1984.60, the 23.6% Fibonacci retracement, to challenge the 2012.60-18.90 area marked by the September 3 high and the 38.2% expansion. A break above this barrier exposes the 50% threshold at 2032.80. Alternatively, a reversal below support targets the 38.2% retracement at 1967.30.
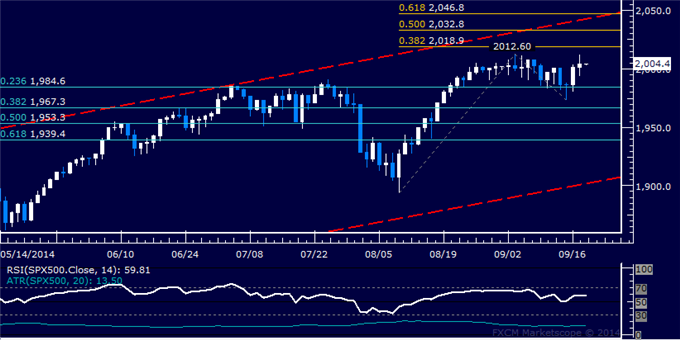
Daily Chart - Created Using FXCM Marketscope 2.0
GOLD TECHNICAL ANALYSIS – Prices broke downward, with sellers now aiming to challenge the 23.6% Fibonacci expansion at 1213.75. A break below this barrier on a daily closing basis exposes the 38.2% level at 1196.30. Alternatively, a reversal above the 14.6% Fib at 1224.50 targets the September 16 high at 1241.95

Daily Chart - Created Using FXCM Marketscope 2.0
CRUDE OIL TECHNICAL ANALYSIS – Prices are edging higher as expected after putting in a bullish Piercing Line candlestick pattern above support at 96.73, the mid-April 2013 low. Near-term resistance is at 99.47, the 14.6% Fibonacci retracement, with a break above that on a daily closing basis exposing the 23.6% level at 101.18.
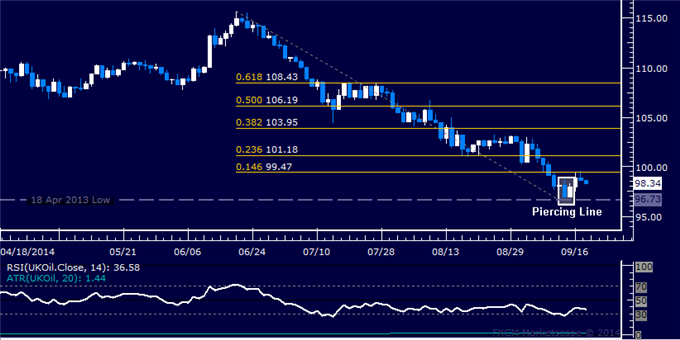
Daily Chart - Created Using FXCM Marketscope 2.0
--- Written by Ilya Spivak, Currency Strategist for DailyFX.com
To receive Ilya's analysis directly via email, please SIGN UP HERE
Contact and follow Ilya on Twitter: @IlyaSpivak
DailyFX provides forex news and technical analysis on the trends that influence the global currency markets.
Learn forex trading with a free practice account and trading charts from FXCM.
