3 Swedish Stocks That May Be Undervalued In September 2024
As global markets react to the recent Federal Reserve rate cut, European stocks have shown mixed performance with a cautious outlook on monetary policy. Amid this environment, identifying undervalued stocks in Sweden could present unique opportunities for investors. In light of these market conditions, a good stock is typically characterized by strong fundamentals, resilience to economic fluctuations, and potential for growth despite broader market uncertainties.
Top 10 Undervalued Stocks Based On Cash Flows In Sweden
Name | Current Price | Fair Value (Est) | Discount (Est) |
Concentric (OM:COIC) | SEK221.00 | SEK407.66 | 45.8% |
Lindab International (OM:LIAB) | SEK290.00 | SEK532.08 | 45.5% |
Biotage (OM:BIOT) | SEK184.40 | SEK365.03 | 49.5% |
Securitas (OM:SECU B) | SEK130.55 | SEK258.74 | 49.5% |
Cavotec (OM:CCC) | SEK21.00 | SEK41.62 | 49.5% |
Tourn International (OM:TOURN) | SEK8.98 | SEK16.47 | 45.5% |
MilDef Group (OM:MILDEF) | SEK85.80 | SEK160.46 | 46.5% |
BHG Group (OM:BHG) | SEK14.67 | SEK26.83 | 45.3% |
Sinch (OM:SINCH) | SEK32.26 | SEK64.22 | 49.8% |
Lyko Group (OM:LYKO A) | SEK115.00 | SEK215.66 | 46.7% |
We're going to check out a few of the best picks from our screener tool.
H & M Hennes & Mauritz
Overview: H & M Hennes & Mauritz AB (publ) is a global retailer offering clothing, accessories, footwear, cosmetics, home textiles, and homeware for women, men, and children with a market cap of SEK278.62 billion.
Operations: The company's revenue segments include clothing, accessories, footwear, cosmetics, home textiles, and homeware for women, men, and children worldwide.
Estimated Discount To Fair Value: 18%
H & M Hennes & Mauritz AB is trading at SEK 173, below its estimated fair value of SEK 210.91. Despite a dip in recent quarterly earnings, the company has shown solid profit growth over the past year and forecasts indicate continued annual earnings growth of 15.55%, outpacing the Swedish market average. However, its dividend yield of 3.76% is not well covered by earnings, raising sustainability concerns despite strong revenue forecasts and return on equity projections.
Nolato
Overview: Nolato AB (publ) develops, manufactures, and sells plastic, silicone, and thermoplastic elastomer products for various sectors including medical technology, pharmaceutical, consumer electronics, telecom, automotive, hygiene, and other industrial sectors globally; it has a market cap of SEK15.00 billion.
Operations: Nolato's revenue segments include SEK5.34 billion from Medical Solutions, with additional segment adjustments of SEK4.15 billion and minor parent company adjustments.
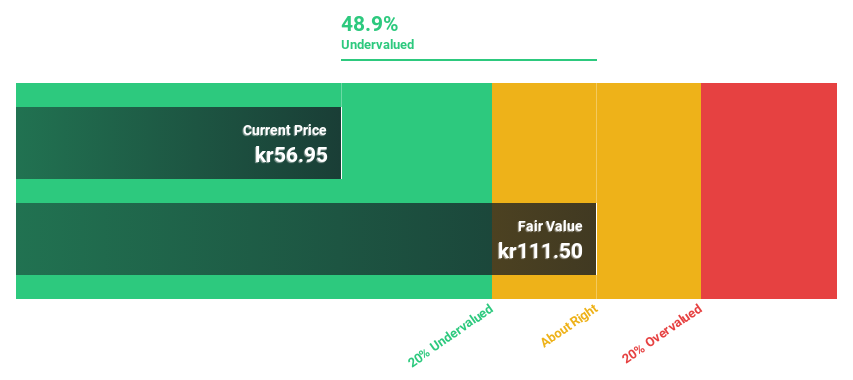
Estimated Discount To Fair Value: 43.8%
Nolato AB is trading at SEK 55.7, significantly below its estimated fair value of SEK 99.14. Recent earnings reports show steady performance with net income rising to SEK 169 million in Q2 from SEK 155 million a year ago. Earnings are forecast to grow at an impressive rate of over 23% annually, outpacing the Swedish market average. However, despite strong revenue growth projections and attractive valuation metrics, Nolato's return on equity is expected to remain modest at 14.6%.
Insights from our recent growth report point to a promising forecast for Nolato's business outlook.
Take a closer look at Nolato's balance sheet health here in our report.
Vimian Group
Overview: Vimian Group AB (publ) operates in the global animal health industry and has a market capitalization of SEK23.90 billion.
Operations: Vimian Group AB (publ) generates revenue through its Medtech (€111.91 million), Diagnostics (€20.63 million), Specialty Pharma (€158.39 million), and Veterinary Services (€53.95 million) segments in the animal health industry worldwide.
Estimated Discount To Fair Value: 16.3%
Vimian Group is trading at SEK 45.75, below its estimated fair value of SEK 54.68. Despite significant insider selling over the past three months and recent shareholder dilution, Vimian's earnings are forecast to grow significantly at 64.1% annually, well above the Swedish market average of 15%. Recent earnings reports show steady growth with Q2 sales reaching EUR 90.99 million compared to EUR 81.31 million a year ago and net income rising to EUR 4.87 million from EUR 2.99 million last year.
Summing It All Up
Click here to access our complete index of 46 Undervalued Swedish Stocks Based On Cash Flows.
Shareholder in one or more of these companies? Ensure you're never caught off-guard by adding your portfolio in Simply Wall St for timely alerts on significant stock developments.
Unlock the power of informed investing with Simply Wall St, your free guide to navigating stock markets worldwide.
Contemplating Other Strategies?
Explore high-performing small cap companies that haven't yet garnered significant analyst attention.
Diversify your portfolio with solid dividend payers offering reliable income streams to weather potential market turbulence.
Fuel your portfolio with companies showing strong growth potential, backed by optimistic outlooks both from analysts and management.
This article by Simply Wall St is general in nature. We provide commentary based on historical data and analyst forecasts only using an unbiased methodology and our articles are not intended to be financial advice. It does not constitute a recommendation to buy or sell any stock, and does not take account of your objectives, or your financial situation. We aim to bring you long-term focused analysis driven by fundamental data. Note that our analysis may not factor in the latest price-sensitive company announcements or qualitative material. Simply Wall St has no position in any stocks mentioned.
Companies discussed in this article include OM:HM B OM:NOLA B and OM:VIMIAN.
Have feedback on this article? Concerned about the content? Get in touch with us directly. Alternatively, email editorial-team@simplywallst.com

 Yahoo Finance


