
 Yahoo Finance
 4.1% earnings growth over 3 years has not materialized into gains for Trex Company (NYSE:TREX) shareholders over that period
For many investors, the main point of stock picking is to generate higher returns than the overall market. But its virtually certain that sometimes you will buy stocks that fall short of the market average returns. We regret to report that long term Trex Company, Inc. (NYSE:TREX) shareholders have had that experience, with the share price dropping 44% in three years, versus a market return of about 18%. Shareholders have had an even rougher run lately, with the share price down 23% in the last 90 days.
Since Trex Company has shed US$300m from its value in the past 7 days, let's see if the longer term decline has been driven by the business' economics.
Check out our latest analysis for Trex Company
To quote Buffett, 'Ships will sail around the world but the Flat Earth Society will flourish. There will continue to be wide discrepancies between price and value in the marketplace...' By comparing earnings per share (EPS) and share price changes over time, we can get a feel for how investor attitudes to a company have morphed over time.
Although the share price is down over three years, Trex Company actually managed to grow EPS by 13% per year in that time. This is quite a puzzle, and suggests there might be something temporarily buoying the share price. Or else the company was over-hyped in the past, and so its growth has disappointed.
Since the change in EPS doesn't seem to correlate with the change in share price, it's worth taking a look at other metrics.
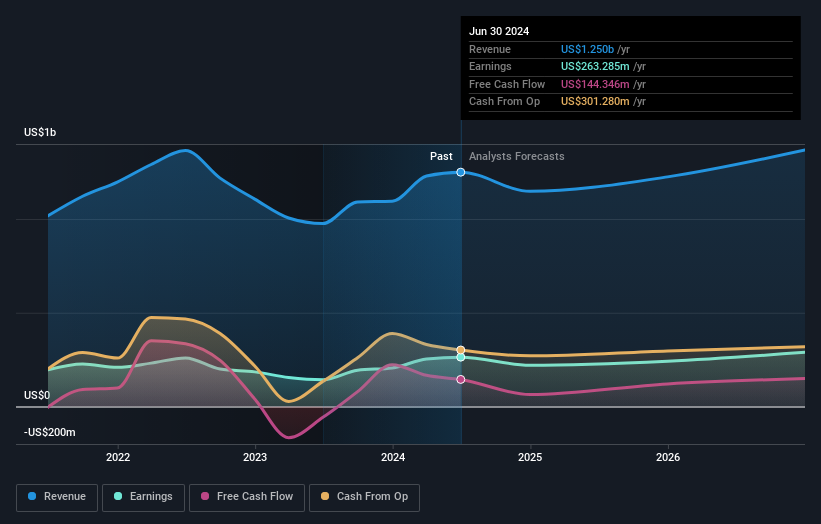
With revenue flat over three years, it seems unlikely that the share price is reflecting the top line. There doesn't seem to be any clear correlation between the fundamental business metrics and the share price. That could mean that the stock was previously overrated, or it could spell opportunity now.
The image below shows how earnings and revenue have tracked over time (if you click on the image you can see greater detail).
Trex Company is well known by investors, and plenty of clever analysts have tried to predict the future profit levels. So we recommend checking out this free report showing consensus forecasts
A Different Perspective
While the broader market gained around 25% in the last year, Trex Company shareholders lost 12%. However, keep in mind that even the best stocks will sometimes underperform the market over a twelve month period. On the bright side, long term shareholders have made money, with a gain of 7% per year over half a decade. It could be that the recent sell-off is an opportunity, so it may be worth checking the fundamental data for signs of a long term growth trend. Before spending more time on Trex Company it might be wise to click here to see if insiders have been buying or selling shares.
If you would prefer to check out another company -- one with potentially superior financials -- then do not miss this free list of companies that have proven they can grow earnings.
Please note, the market returns quoted in this article reflect the market weighted average returns of stocks that currently trade on American exchanges.
Have feedback on this article? Concerned about the content? Get in touch with us directly. Alternatively, email editorial-team (at) simplywallst.com.
This article by Simply Wall St is general in nature. We provide commentary based on historical data and analyst forecasts only using an unbiased methodology and our articles are not intended to be financial advice. It does not constitute a recommendation to buy or sell any stock, and does not take account of your objectives, or your financial situation. We aim to bring you long-term focused analysis driven by fundamental data. Note that our analysis may not factor in the latest price-sensitive company announcements or qualitative material. Simply Wall St has no position in any stocks mentioned.
