
 Yahoo Finance
 Advanced Micro Devices' (NASDAQ:AMD) five-year total shareholder returns outpace the underlying earnings growth
It might be of some concern to shareholders to see the Advanced Micro Devices, Inc. (NASDAQ:AMD) share price down 16% in the last month. But over five years returns have been remarkably great. Indeed, the share price is up a whopping 490% in that time. Arguably, the recent fall is to be expected after such a strong rise. The most important thing for savvy investors to consider is whether the underlying business can justify the share price gain.
In light of the stock dropping 4.2% in the past week, we want to investigate the longer term story, and see if fundamentals have been the driver of the company's positive five-year return.
View our latest analysis for Advanced Micro Devices
While the efficient markets hypothesis continues to be taught by some, it has been proven that markets are over-reactive dynamic systems, and investors are not always rational. One way to examine how market sentiment has changed over time is to look at the interaction between a company's share price and its earnings per share (EPS).
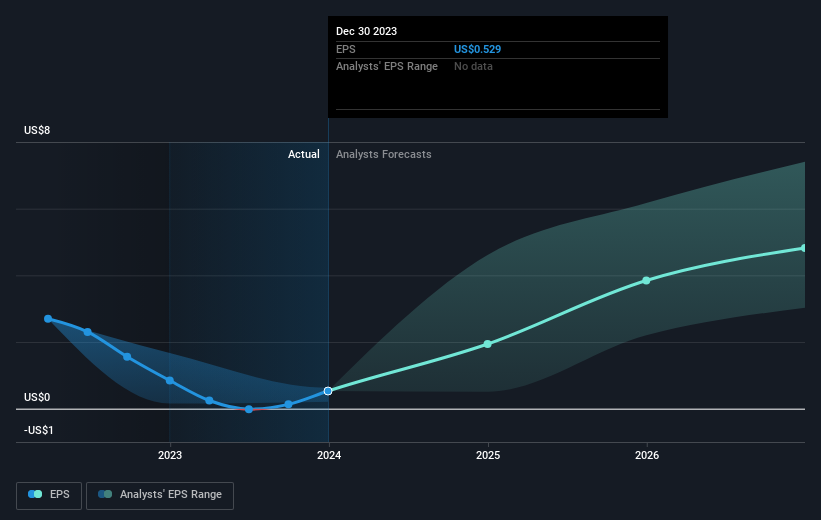
During five years of share price growth, Advanced Micro Devices achieved compound earnings per share (EPS) growth of 9.0% per year. This EPS growth is lower than the 43% average annual increase in the share price. This suggests that market participants hold the company in higher regard, these days. And that's hardly shocking given the track record of growth. This optimism is visible in its fairly high P/E ratio of 309.00.
The company's earnings per share (over time) is depicted in the image below (click to see the exact numbers).
Before buying or selling a stock, we always recommend a close examination of historic growth trends, available here.
A Different Perspective
It's nice to see that Advanced Micro Devices shareholders have received a total shareholder return of 78% over the last year. That's better than the annualised return of 43% over half a decade, implying that the company is doing better recently. Given the share price momentum remains strong, it might be worth taking a closer look at the stock, lest you miss an opportunity. It's always interesting to track share price performance over the longer term. But to understand Advanced Micro Devices better, we need to consider many other factors. For instance, we've identified 2 warning signs for Advanced Micro Devices that you should be aware of.
Of course Advanced Micro Devices may not be the best stock to buy. So you may wish to see this free collection of growth stocks.
Please note, the market returns quoted in this article reflect the market weighted average returns of stocks that currently trade on American exchanges.
Have feedback on this article? Concerned about the content? Get in touch with us directly. Alternatively, email editorial-team (at) simplywallst.com.
This article by Simply Wall St is general in nature. We provide commentary based on historical data and analyst forecasts only using an unbiased methodology and our articles are not intended to be financial advice. It does not constitute a recommendation to buy or sell any stock, and does not take account of your objectives, or your financial situation. We aim to bring you long-term focused analysis driven by fundamental data. Note that our analysis may not factor in the latest price-sensitive company announcements or qualitative material. Simply Wall St has no position in any stocks mentioned.
