
 Yahoo Finance
 ASML Holding's (AMS:ASML) 40% CAGR outpaced the company's earnings growth over the same five-year period
For many, the main point of investing in the stock market is to achieve spectacular returns. While not every stock performs well, when investors win, they can win big. Don't believe it? Then look at the ASML Holding N.V. (AMS:ASML) share price. It's 420% higher than it was five years ago. And this is just one example of the epic gains achieved by some long term investors. In the last week the share price is up 3.2%.
After a strong gain in the past week, it's worth seeing if longer term returns have been driven by improving fundamentals.
Check out our latest analysis for ASML Holding
While markets are a powerful pricing mechanism, share prices reflect investor sentiment, not just underlying business performance. One way to examine how market sentiment has changed over time is to look at the interaction between a company's share price and its earnings per share (EPS).
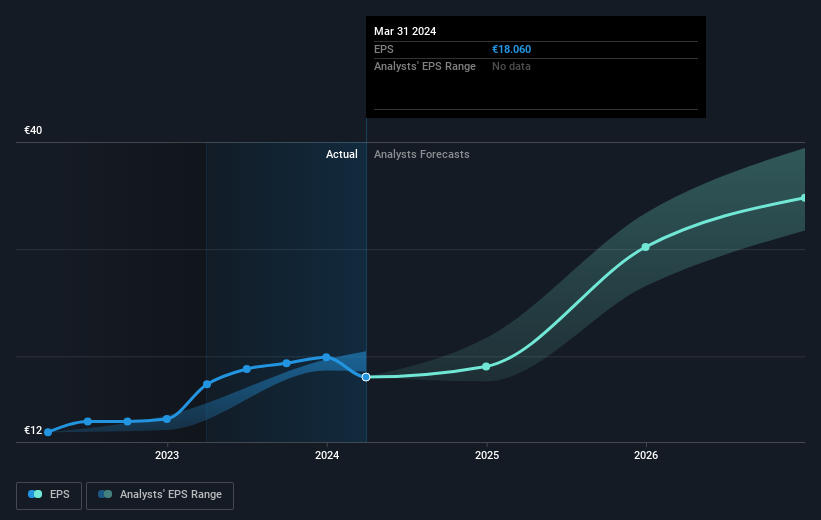
During five years of share price growth, ASML Holding achieved compound earnings per share (EPS) growth of 26% per year. This EPS growth is lower than the 39% average annual increase in the share price. So it's fair to assume the market has a higher opinion of the business than it did five years ago. And that's hardly shocking given the track record of growth. This favorable sentiment is reflected in its (fairly optimistic) P/E ratio of 48.69.
The graphic below depicts how EPS has changed over time (unveil the exact values by clicking on the image).
Before buying or selling a stock, we always recommend a close examination of historic growth trends, available here.
What About Dividends?
When looking at investment returns, it is important to consider the difference between total shareholder return (TSR) and share price return. The TSR incorporates the value of any spin-offs or discounted capital raisings, along with any dividends, based on the assumption that the dividends are reinvested. So for companies that pay a generous dividend, the TSR is often a lot higher than the share price return. We note that for ASML Holding the TSR over the last 5 years was 444%, which is better than the share price return mentioned above. This is largely a result of its dividend payments!
A Different Perspective
It's good to see that ASML Holding has rewarded shareholders with a total shareholder return of 30% in the last twelve months. That's including the dividend. Having said that, the five-year TSR of 40% a year, is even better. I find it very interesting to look at share price over the long term as a proxy for business performance. But to truly gain insight, we need to consider other information, too. Case in point: We've spotted 1 warning sign for ASML Holding you should be aware of.
We will like ASML Holding better if we see some big insider buys. While we wait, check out this free list of undervalued stocks (mostly small caps) with considerable, recent, insider buying.
Please note, the market returns quoted in this article reflect the market weighted average returns of stocks that currently trade on Dutch exchanges.
Have feedback on this article? Concerned about the content? Get in touch with us directly. Alternatively, email editorial-team (at) simplywallst.com.
This article by Simply Wall St is general in nature. We provide commentary based on historical data and analyst forecasts only using an unbiased methodology and our articles are not intended to be financial advice. It does not constitute a recommendation to buy or sell any stock, and does not take account of your objectives, or your financial situation. We aim to bring you long-term focused analysis driven by fundamental data. Note that our analysis may not factor in the latest price-sensitive company announcements or qualitative material. Simply Wall St has no position in any stocks mentioned.
