
 Yahoo Finance
 Could The Market Be Wrong About Nynomic AG (ETR:M7U) Given Its Attractive Financial Prospects?
With its stock down 18% over the past three months, it is easy to disregard Nynomic (ETR:M7U). But if you pay close attention, you might gather that its strong financials could mean that the stock could potentially see an increase in value in the long-term, given how markets usually reward companies with good financial health. In this article, we decided to focus on Nynomic's ROE.
ROE or return on equity is a useful tool to assess how effectively a company can generate returns on the investment it received from its shareholders. In other words, it is a profitability ratio which measures the rate of return on the capital provided by the company's shareholders.
See our latest analysis for Nynomic
How To Calculate Return On Equity?
The formula for ROE is:
Return on Equity = Net Profit (from continuing operations) ÷ Shareholders' Equity
So, based on the above formula, the ROE for Nynomic is:
10% = €11m ÷ €104m (Based on the trailing twelve months to December 2023).
The 'return' is the profit over the last twelve months. Another way to think of that is that for every €1 worth of equity, the company was able to earn €0.10 in profit.
What Is The Relationship Between ROE And Earnings Growth?
We have already established that ROE serves as an efficient profit-generating gauge for a company's future earnings. Depending on how much of these profits the company reinvests or "retains", and how effectively it does so, we are then able to assess a company’s earnings growth potential. Assuming all else is equal, companies that have both a higher return on equity and higher profit retention are usually the ones that have a higher growth rate when compared to companies that don't have the same features.
Nynomic's Earnings Growth And 10% ROE
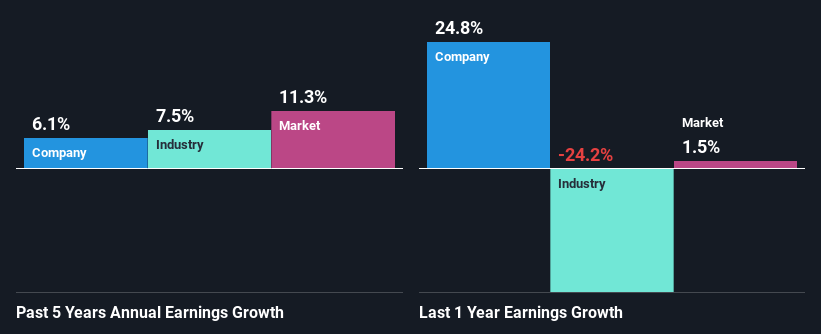
To start with, Nynomic's ROE looks acceptable. And on comparing with the industry, we found that the the average industry ROE is similar at 9.0%. This certainly adds some context to Nynomic's moderate 6.1% net income growth seen over the past five years.
Next, on comparing Nynomic's net income growth with the industry, we found that the company's reported growth is similar to the industry average growth rate of 7.5% over the last few years.
Earnings growth is a huge factor in stock valuation. What investors need to determine next is if the expected earnings growth, or the lack of it, is already built into the share price. Doing so will help them establish if the stock's future looks promising or ominous. Is Nynomic fairly valued compared to other companies? These 3 valuation measures might help you decide.
Is Nynomic Making Efficient Use Of Its Profits?
Given that Nynomic doesn't pay any regular dividends to its shareholders, we infer that the company has been reinvesting all of its profits to grow its business.
Conclusion
Overall, we are quite pleased with Nynomic's performance. Specifically, we like that the company is reinvesting a huge chunk of its profits at a high rate of return. This of course has caused the company to see substantial growth in its earnings. With that said, the latest industry analyst forecasts reveal that the company's earnings are expected to accelerate. Are these analysts expectations based on the broad expectations for the industry, or on the company's fundamentals? Click here to be taken to our analyst's forecasts page for the company.
Have feedback on this article? Concerned about the content? Get in touch with us directly. Alternatively, email editorial-team (at) simplywallst.com.
This article by Simply Wall St is general in nature. We provide commentary based on historical data and analyst forecasts only using an unbiased methodology and our articles are not intended to be financial advice. It does not constitute a recommendation to buy or sell any stock, and does not take account of your objectives, or your financial situation. We aim to bring you long-term focused analysis driven by fundamental data. Note that our analysis may not factor in the latest price-sensitive company announcements or qualitative material. Simply Wall St has no position in any stocks mentioned.
Have feedback on this article? Concerned about the content? Get in touch with us directly. Alternatively, email editorial-team@simplywallst.com
