
 Yahoo Finance
 Endava (NYSE:DAVA) Will Be Hoping To Turn Its Returns On Capital Around
Finding a business that has the potential to grow substantially is not easy, but it is possible if we look at a few key financial metrics. In a perfect world, we'd like to see a company investing more capital into its business and ideally the returns earned from that capital are also increasing. Ultimately, this demonstrates that it's a business that is reinvesting profits at increasing rates of return. Looking at Endava (NYSE:DAVA), it does have a high ROCE right now, but lets see how returns are trending.
Return On Capital Employed (ROCE): What Is It?
Just to clarify if you're unsure, ROCE is a metric for evaluating how much pre-tax income (in percentage terms) a company earns on the capital invested in its business. The formula for this calculation on Endava is:
Return on Capital Employed = Earnings Before Interest and Tax (EBIT) ÷ (Total Assets - Current Liabilities)
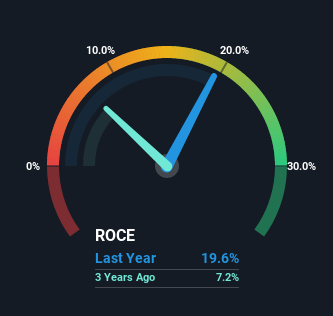
0.20 = UK£113m ÷ (UK£708m - UK£131m) (Based on the trailing twelve months to December 2022).
Therefore, Endava has an ROCE of 20%. In absolute terms that's a great return and it's even better than the IT industry average of 11%.
Check out our latest analysis for Endava
In the above chart we have measured Endava's prior ROCE against its prior performance, but the future is arguably more important. If you're interested, you can view the analysts predictions in our free report on analyst forecasts for the company.
What Does the ROCE Trend For Endava Tell Us?
In terms of Endava's historical ROCE movements, the trend isn't fantastic. To be more specific, while the ROCE is still high, it's fallen from 38% where it was five years ago. However, given capital employed and revenue have both increased it appears that the business is currently pursuing growth, at the consequence of short term returns. If these investments prove successful, this can bode very well for long term stock performance.
On a related note, Endava has decreased its current liabilities to 18% of total assets. So we could link some of this to the decrease in ROCE. What's more, this can reduce some aspects of risk to the business because now the company's suppliers or short-term creditors are funding less of its operations. Some would claim this reduces the business' efficiency at generating ROCE since it is now funding more of the operations with its own money.
The Key Takeaway
While returns have fallen for Endava in recent times, we're encouraged to see that sales are growing and that the business is reinvesting in its operations. And the stock has followed suit returning a meaningful 88% to shareholders over the last three years. So should these growth trends continue, we'd be optimistic on the stock going forward.
One more thing, we've spotted 1 warning sign facing Endava that you might find interesting.
High returns are a key ingredient to strong performance, so check out our free list ofstocks earning high returns on equity with solid balance sheets.
Have feedback on this article? Concerned about the content? Get in touch with us directly. Alternatively, email editorial-team (at) simplywallst.com.
This article by Simply Wall St is general in nature. We provide commentary based on historical data and analyst forecasts only using an unbiased methodology and our articles are not intended to be financial advice. It does not constitute a recommendation to buy or sell any stock, and does not take account of your objectives, or your financial situation. We aim to bring you long-term focused analysis driven by fundamental data. Note that our analysis may not factor in the latest price-sensitive company announcements or qualitative material. Simply Wall St has no position in any stocks mentioned.
Join A Paid User Research Session
You’ll receive a US$30 Amazon Gift card for 1 hour of your time while helping us build better investing tools for the individual investors like yourself. Sign up here
