
 Yahoo Finance
 Estimating The Fair Value Of Arvida Group Limited (NZSE:ARV)
Today we'll do a simple run through of a valuation method used to estimate the attractiveness of Arvida Group Limited (NZSE:ARV) as an investment opportunity by taking the expected future cash flows and discounting them to today's value. We will use the Discounted Cash Flow (DCF) model on this occasion. It may sound complicated, but actually it is quite simple!
Remember though, that there are many ways to estimate a company's value, and a DCF is just one method. For those who are keen learners of equity analysis, the Simply Wall St analysis model here may be something of interest to you.
View our latest analysis for Arvida Group
The Calculation
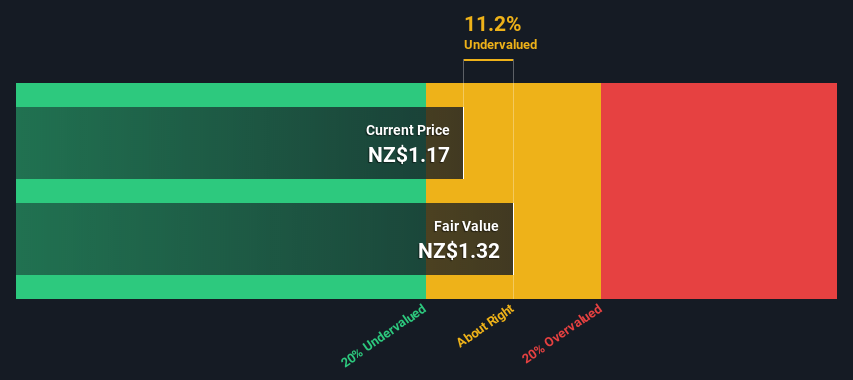
As Arvida Group operates in the healthcare sector, we need to calculate the intrinsic value slightly differently. In this approach dividends per share (DPS) are used, as free cash flow is difficult to estimate and often not reported by analysts. This often underestimates the value of a stock, but it can still be good as a comparison to competitors. The 'Gordon Growth Model' is used, which simply assumes that dividend payments will continue to increase at a sustainable growth rate forever. The dividend is expected to grow at an annual growth rate equal to the 5-year average of the 10-year government bond yield of 2.2%. We then discount this figure to today's value at a cost of equity of 6.9%. Compared to the current share price of NZ$1.2, the company appears about fair value at a 11% discount to where the stock price trades currently. Valuations are imprecise instruments though, rather like a telescope - move a few degrees and end up in a different galaxy. Do keep this in mind.
Value Per Share = Expected Dividend Per Share / (Discount Rate - Perpetual Growth Rate)
= NZ$0.06 / (6.9% – 2.2%)
= NZ$1.3
The Assumptions
Now the most important inputs to a discounted cash flow are the discount rate, and of course, the actual cash flows. If you don't agree with these result, have a go at the calculation yourself and play with the assumptions. The DCF also does not consider the possible cyclicality of an industry, or a company's future capital requirements, so it does not give a full picture of a company's potential performance. Given that we are looking at Arvida Group as potential shareholders, the cost of equity is used as the discount rate, rather than the cost of capital (or weighted average cost of capital, WACC) which accounts for debt. In this calculation we've used 6.9%, which is based on a levered beta of 0.800. Beta is a measure of a stock's volatility, compared to the market as a whole. We get our beta from the industry average beta of globally comparable companies, with an imposed limit between 0.8 and 2.0, which is a reasonable range for a stable business.
SWOT Analysis for Arvida Group
Strength
Earnings growth over the past year exceeded the industry.
Debt is well covered by cash flow.
Dividends are covered by earnings and cash flows.
Weakness
Earnings growth over the past year is below its 5-year average.
Interest payments on debt are not well covered.
Dividend is low compared to the top 25% of dividend payers in the Healthcare market.
Opportunity
Annual revenue is forecast to grow faster than the New Zealander market.
Good value based on P/E ratio and estimated fair value.
Significant insider buying over the past 3 months.
Threat
Annual earnings are forecast to decline for the next 3 years.
Next Steps:
Whilst important, the DCF calculation is only one of many factors that you need to assess for a company. DCF models are not the be-all and end-all of investment valuation. Preferably you'd apply different cases and assumptions and see how they would impact the company's valuation. For example, changes in the company's cost of equity or the risk free rate can significantly impact the valuation. For Arvida Group, we've put together three additional factors you should assess:
Risks: Case in point, we've spotted 3 warning signs for Arvida Group you should be aware of, and 1 of them is a bit unpleasant.
Future Earnings: How does ARV's growth rate compare to its peers and the wider market? Dig deeper into the analyst consensus number for the upcoming years by interacting with our free analyst growth expectation chart.
Other High Quality Alternatives: Do you like a good all-rounder? Explore our interactive list of high quality stocks to get an idea of what else is out there you may be missing!
PS. The Simply Wall St app conducts a discounted cash flow valuation for every stock on the NZSE every day. If you want to find the calculation for other stocks just search here.
Have feedback on this article? Concerned about the content? Get in touch with us directly. Alternatively, email editorial-team (at) simplywallst.com.
This article by Simply Wall St is general in nature. We provide commentary based on historical data and analyst forecasts only using an unbiased methodology and our articles are not intended to be financial advice. It does not constitute a recommendation to buy or sell any stock, and does not take account of your objectives, or your financial situation. We aim to bring you long-term focused analysis driven by fundamental data. Note that our analysis may not factor in the latest price-sensitive company announcements or qualitative material. Simply Wall St has no position in any stocks mentioned.
Join A Paid User Research Session
You’ll receive a US$30 Amazon Gift card for 1 hour of your time while helping us build better investing tools for the individual investors like yourself. Sign up here
