
 Yahoo Finance
 Evonik Industries AG's Dividend Analysis
An In-depth Look at Evonik Industries AG's Dividend Sustainability and Growth Prospects
Evonik Industries AG (EVKIY) recently announced a dividend of $0.63 per share, payable on 2024-06-24, with the ex-dividend date set for 2024-06-06. As investors look forward to this upcoming payment, the spotlight also shines on the company's dividend history, yield, and growth rates. Using the data from GuruFocus, let's look into Evonik Industries AG's dividend performance and assess its sustainability.
What Does Evonik Industries AG Do?
This Powerful Chart Made Peter Lynch 29% A Year For 13 Years
How to calculate the intrinsic value of a stock?
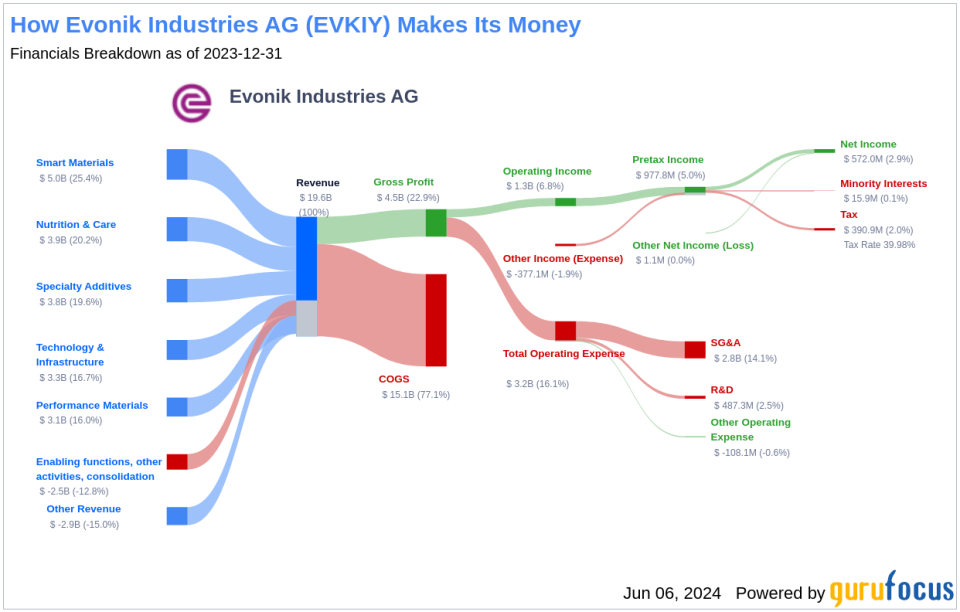
Evonik Industries is a German chemical company offering a mix of speciality and commodity chemical products. It has a number-one to -three market position in 80% of its businesses. Around 45% of sales are generated in Europe, while the key markets of North America and Asia account for 25% and 20% of sales, respectively. The company is organized into four major segments: specialty additives, smart materials, nutrition and care, and performance materials.
A Glimpse at Evonik Industries AG's Dividend History
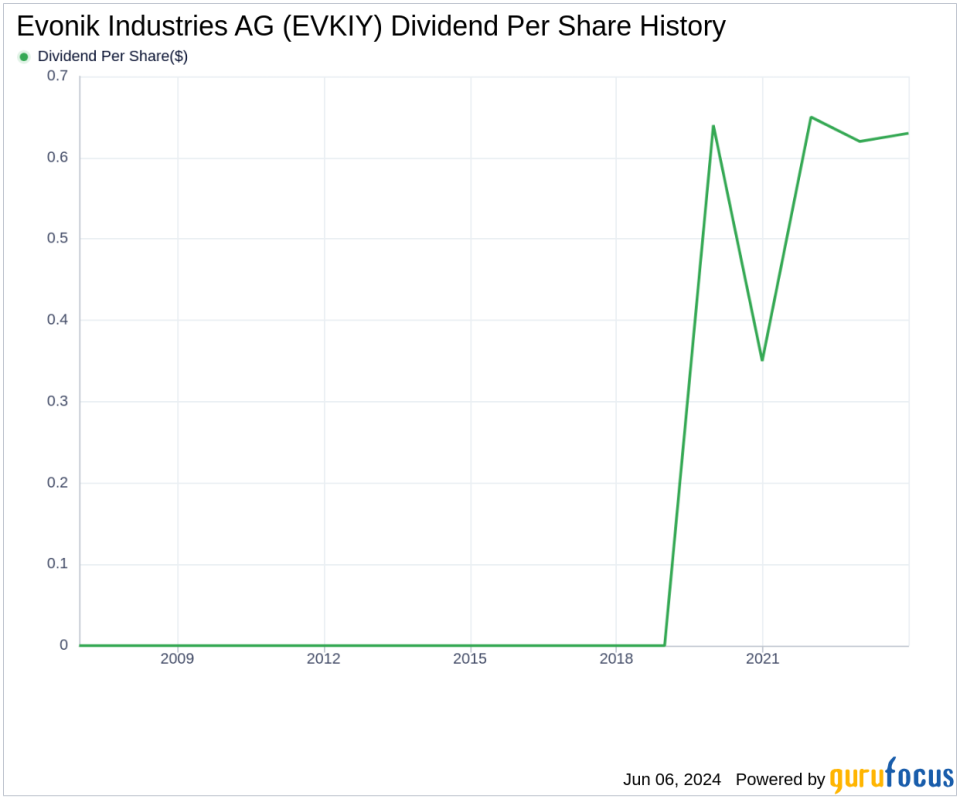
Evonik Industries AG has maintained a consistent dividend payment record since 2019. Dividends are currently distributed on a yearly basis. Below is a chart showing annual Dividends Per Share for tracking historical trends.
Breaking Down Evonik Industries AG's Dividend Yield and Growth
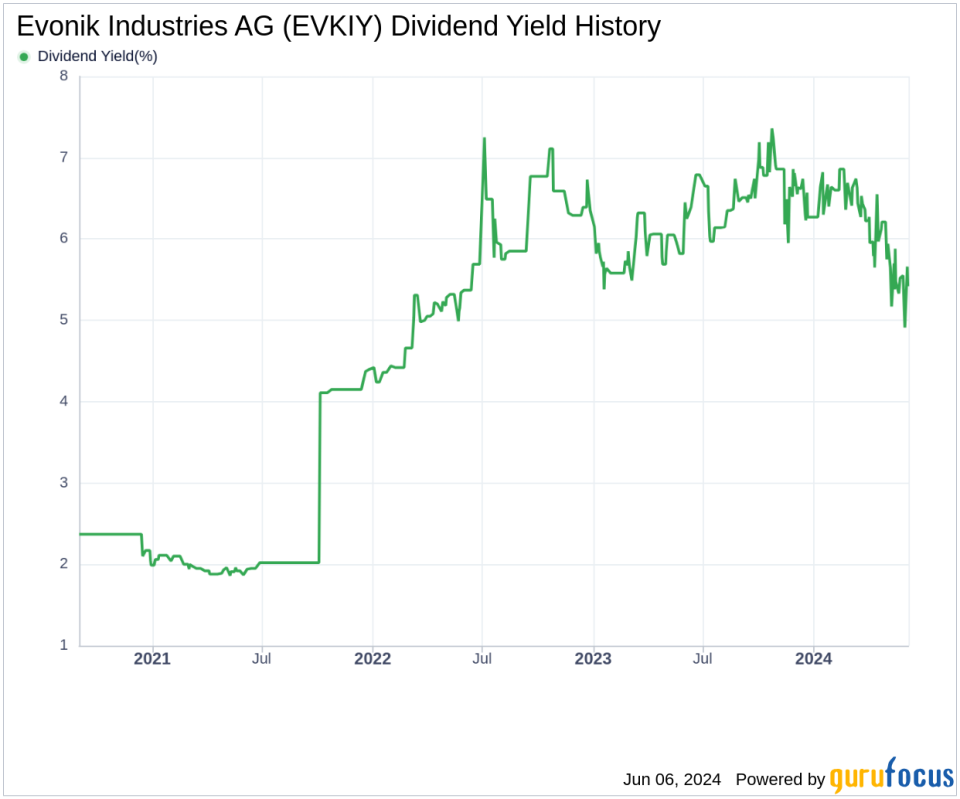
As of today, Evonik Industries AG currently has a 12-month trailing dividend yield of 5.42% and a 12-month forward dividend yield of 5.51%. This suggests an expectation of increased dividend payments over the next 12 months.
Over the past three years, Evonik Industries AG's annual dividend growth rate was 0.60%. Extended to a five-year horizon, this rate decreased to 0.40% per year. Based on Evonik Industries AG's dividend yield and five-year growth rate, the 5-year yield on cost of Evonik Industries AG stock as of today is approximately 5.53%.
The Sustainability Question: Payout Ratio and Profitability
To assess the sustainability of the dividend, one needs to evaluate the company's payout ratio. The dividend payout ratio provides insights into the portion of earnings the company distributes as dividends. A lower ratio suggests that the company retains a significant part of its earnings, thereby ensuring the availability of funds for future growth and unexpected downturns. As of 2024-03-31, Evonik Industries AG's dividend payout ratio is 1.22, which may suggest that the company's dividend may not be sustainable.
Evonik Industries AG's profitability rank, offers an understanding of the company's earnings prowess relative to its peers. GuruFocus ranks Evonik Industries AG's profitability 6 out of 10 as of 2024-03-31, suggesting fair profitability. The company has reported net profit in 9 years out of past 10 years.
Growth Metrics: The Future Outlook
To ensure the sustainability of dividends, a company must have robust growth metrics. Evonik Industries AG's growth rank of 6 out of 10 suggests that the company has a fair growth outlook.
Revenue is the lifeblood of any company, and Evonik Industries AG's revenue per share, combined with the 3-year revenue growth rate, indicates a strong revenue model. Evonik Industries AG's revenue has increased by approximately 7.80% per year on average, a rate that underperforms than approximately 51.77% of global competitors.
The company's 3-year EPS growth rate showcases its capability to grow its earnings, a critical component for sustaining dividends in the long run. During the past three years, Evonik Industries AG's earnings increased by approximately -8.90% per year on average, a rate that underperforms than approximately 67.34% of global competitors.
Lastly, the company's 5-year EBITDA growth rate of -7.30%, which underperforms than approximately 77.05% of global competitors.
Conclusion
While Evonik Industries AG offers a compelling dividend yield and has maintained a consistent dividend payment history, the sustainability of its dividends is questionable given its low dividend growth rates, high payout ratio, and underperforming growth metrics. Investors should consider these factors carefully before making investment decisions. GuruFocus Premium users can screen for high-dividend yield stocks using the High Dividend Yield Screener.
This article, generated by GuruFocus, is designed to provide general insights and is not tailored financial advice. Our commentary is rooted in historical data and analyst projections, utilizing an impartial methodology, and is not intended to serve as specific investment guidance. It does not formulate a recommendation to purchase or divest any stock and does not consider individual investment objectives or financial circumstances. Our objective is to deliver long-term, fundamental data-driven analysis. Be aware that our analysis might not incorporate the most recent, price-sensitive company announcements or qualitative information. GuruFocus holds no position in the stocks mentioned herein.
This article first appeared on GuruFocus.
