
 Yahoo Finance
 Groupe Guillin And Two More Top Dividend Stocks On Euronext Paris
Amid heightened political uncertainty with the upcoming snap election, France's market dynamics have been notably tense, evidenced by a significant 1.96% drop in the CAC 40 Index. This backdrop of fluctuating bond yields and cautious economic sentiment across Europe sets a complex stage for investors. In such an environment, discerning investors might look towards dividend stocks like Groupe Guillin as potentially stable investments capable of offering regular income streams during uncertain times.
Top 10 Dividend Stocks In France
Name | Dividend Yield | Dividend Rating |
Samse (ENXTPA:SAMS) | 9.44% | ★★★★★★ |
Rubis (ENXTPA:RUI) | 7.37% | ★★★★★★ |
CBo Territoria (ENXTPA:CBOT) | 6.82% | ★★★★★★ |
VIEL & Cie société anonyme (ENXTPA:VIL) | 4.04% | ★★★★★☆ |
Arkema (ENXTPA:AKE) | 4.29% | ★★★★★☆ |
Teleperformance (ENXTPA:TEP) | 3.75% | ★★★★★☆ |
Carrefour (ENXTPA:CA) | 6.49% | ★★★★★☆ |
Exacompta Clairefontaine (ENXTPA:ALEXA) | 4.11% | ★★★★★☆ |
Sanofi (ENXTPA:SAN) | 4.09% | ★★★★★☆ |
Piscines Desjoyaux (ENXTPA:ALPDX) | 7.81% | ★★★★★☆ |
Click here to see the full list of 35 stocks from our Top Euronext Paris Dividend Stocks screener.
Below we spotlight a couple of our favorites from our exclusive screener.
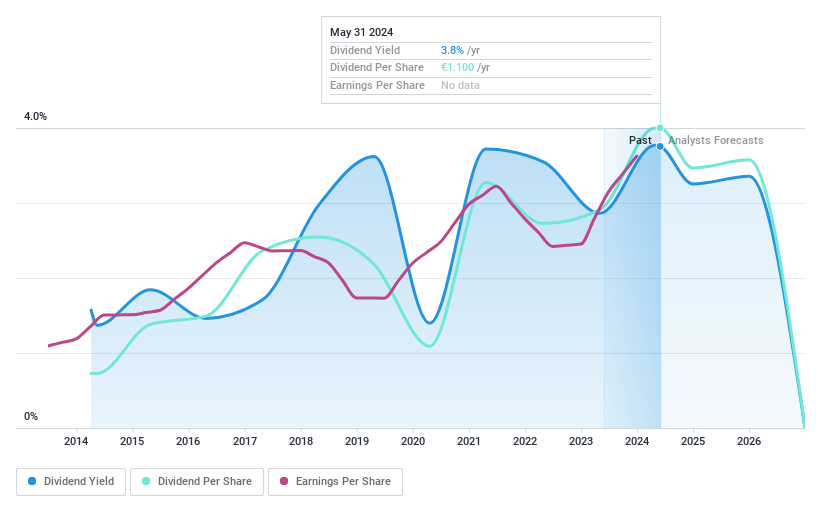
Groupe Guillin
Simply Wall St Dividend Rating: ★★★★☆☆
Overview: Groupe Guillin S.A. is a company based in France that manufactures and distributes food packaging products globally, with a market capitalization of approximately €502.83 million.
Operations: Groupe Guillin S.A. generates revenue primarily through its Material Sector, which contributes €48.24 million, and its Packaging Sector, which accounts for €837.39 million.
Dividend Yield: 4%
Groupe Guillin reported a significant increase in net income to €75.43 million for 2023, up from €50.99 million the previous year, with sales slightly down at €885.86 million. The company's dividends seem sustainable with a payout ratio of 27% and cash payout ratio of 18.5%. However, despite recent growth in earnings and dividends, the dividend track record over the past decade has been unstable and volatile, suggesting potential concerns for long-term dividend reliability.
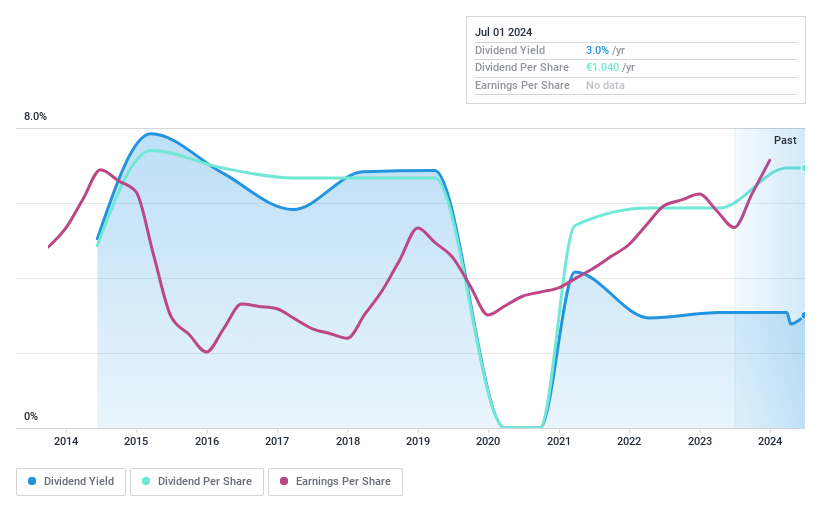
ADLPartner
Simply Wall St Dividend Rating: ★★★★☆☆
Overview: ADLPartner SA, with a market cap of €137.27 million, operates in France and internationally, offering marketing solutions.
Operations: ADLPartner SA generates €199.66 million in revenue from its management consulting services.
Dividend Yield: 3%
ADLPartner SA has declared a dividend of €1.04 per share for fiscal 2023, reflecting a commitment to shareholder returns despite a history of volatile dividends over the past decade. With earnings growth of 11% annually over five years and sales increasing to $52 million in Q1 2024 from $47.9 million the previous year, financial health appears robust. The company's dividend is underpinned by a low payout ratio (33.3%) and cash payout ratio (19.5%), suggesting sustainability, although its yield (3.01%) trails the top French dividend payers.
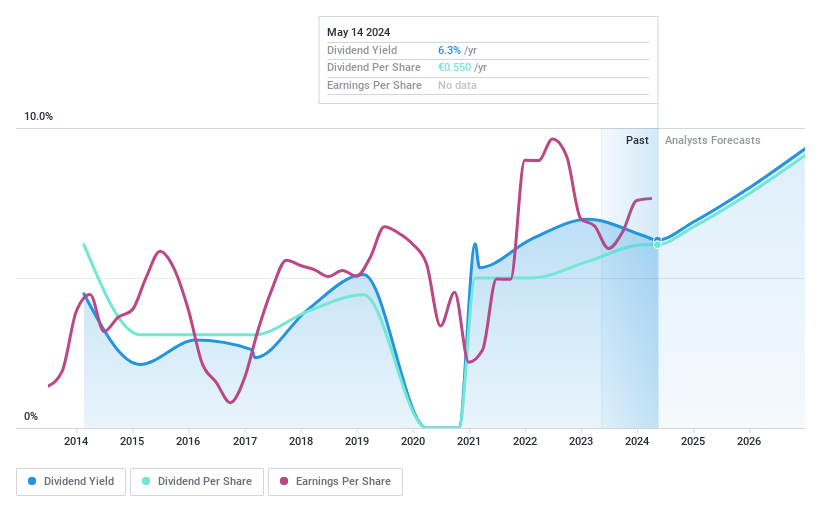
TF1
Simply Wall St Dividend Rating: ★★★★☆☆
Overview: TF1 SA operates in broadcasting, studios and entertainment, and digital sectors both in France and globally, with a market capitalization of approximately €1.62 billion.
Operations: TF1 SA generates revenue primarily through its Media (including Digital) and Newen Studios segments, with earnings of €2.01 billion and €385.70 million respectively.
Dividend Yield: 7.2%
TF1's recent earnings show a slight increase to €511.9 million in sales and €29.7 million in net income for Q1 2024, supporting a stable yet modest dividend profile with a payout ratio of 59.9% and cash payout ratio of 48.3%. Despite this, dividends have not grown over the past decade, indicating potential concerns about long-term growth despite current sustainability from earnings and cash flow perspectives. The stock trades significantly below estimated fair value, suggesting it might be undervalued relative to its financial performance.
Next Steps
Delve into our full catalog of 35 Top Euronext Paris Dividend Stocks here.
Shareholder in one or more of these companies? Ensure you're never caught off-guard by adding your portfolio in Simply Wall St for timely alerts on significant stock developments.
Maximize your investment potential with Simply Wall St, the comprehensive app that offers global market insights for free.
Looking For Alternative Opportunities?
Explore high-performing small cap companies that haven't yet garnered significant analyst attention.
Fuel your portfolio with companies showing strong growth potential, backed by optimistic outlooks both from analysts and management.
Find companies with promising cash flow potential yet trading below their fair value.
This article by Simply Wall St is general in nature. We provide commentary based on historical data and analyst forecasts only using an unbiased methodology and our articles are not intended to be financial advice. It does not constitute a recommendation to buy or sell any stock, and does not take account of your objectives, or your financial situation. We aim to bring you long-term focused analysis driven by fundamental data. Note that our analysis may not factor in the latest price-sensitive company announcements or qualitative material. Simply Wall St has no position in any stocks mentioned.
Companies discussed in this article include ENXTPA:ALGIL ENXTPA:DKUPL and ENXTPA:TFI.
Have feedback on this article? Concerned about the content? Get in touch with us directly. Alternatively, email editorial-team@simplywallst.com
