
 Yahoo Finance
 Gym Group (LON:GYM) Has Some Difficulty Using Its Capital Effectively
To avoid investing in a business that's in decline, there's a few financial metrics that can provide early indications of aging. Businesses in decline often have two underlying trends, firstly, a declining return on capital employed (ROCE) and a declining base of capital employed. Basically the company is earning less on its investments and it is also reducing its total assets. So after glancing at the trends within Gym Group (LON:GYM), we weren't too hopeful.
Understanding Return On Capital Employed (ROCE)
For those that aren't sure what ROCE is, it measures the amount of pre-tax profits a company can generate from the capital employed in its business. Analysts use this formula to calculate it for Gym Group:
Return on Capital Employed = Earnings Before Interest and Tax (EBIT) ÷ (Total Assets - Current Liabilities)
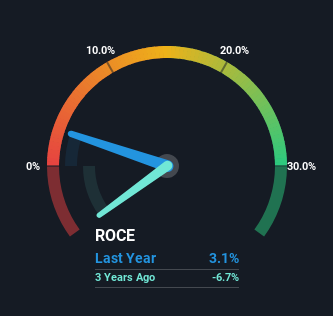
0.031 = UK£15m ÷ (UK£572m - UK£72m) (Based on the trailing twelve months to December 2023).
So, Gym Group has an ROCE of 3.1%. In absolute terms, that's a low return and it also under-performs the Hospitality industry average of 7.5%.
Check out our latest analysis for Gym Group
In the above chart we have measured Gym Group's prior ROCE against its prior performance, but the future is arguably more important. If you'd like, you can check out the forecasts from the analysts covering Gym Group for free.
How Are Returns Trending?
We are a bit worried about the trend of returns on capital at Gym Group. About five years ago, returns on capital were 5.1%, however they're now substantially lower than that as we saw above. Meanwhile, capital employed in the business has stayed roughly the flat over the period. This combination can be indicative of a mature business that still has areas to deploy capital, but the returns received aren't as high due potentially to new competition or smaller margins. So because these trends aren't typically conducive to creating a multi-bagger, we wouldn't hold our breath on Gym Group becoming one if things continue as they have.
The Bottom Line On Gym Group's ROCE
All in all, the lower returns from the same amount of capital employed aren't exactly signs of a compounding machine. It should come as no surprise then that the stock has fallen 47% over the last five years, so it looks like investors are recognizing these changes. With underlying trends that aren't great in these areas, we'd consider looking elsewhere.
Gym Group could be trading at an attractive price in other respects, so you might find our free intrinsic value estimation for GYM on our platform quite valuable.
While Gym Group isn't earning the highest return, check out this free list of companies that are earning high returns on equity with solid balance sheets.
Have feedback on this article? Concerned about the content? Get in touch with us directly. Alternatively, email editorial-team (at) simplywallst.com.
This article by Simply Wall St is general in nature. We provide commentary based on historical data and analyst forecasts only using an unbiased methodology and our articles are not intended to be financial advice. It does not constitute a recommendation to buy or sell any stock, and does not take account of your objectives, or your financial situation. We aim to bring you long-term focused analysis driven by fundamental data. Note that our analysis may not factor in the latest price-sensitive company announcements or qualitative material. Simply Wall St has no position in any stocks mentioned.
