
 Yahoo Finance
 Here's What's Concerning About ANSYS' (NASDAQ:ANSS) Returns On Capital
There are a few key trends to look for if we want to identify the next multi-bagger. Ideally, a business will show two trends; firstly a growing return on capital employed (ROCE) and secondly, an increasing amount of capital employed. Basically this means that a company has profitable initiatives that it can continue to reinvest in, which is a trait of a compounding machine. In light of that, when we looked at ANSYS (NASDAQ:ANSS) and its ROCE trend, we weren't exactly thrilled.
Return On Capital Employed (ROCE): What Is It?
For those who don't know, ROCE is a measure of a company's yearly pre-tax profit (its return), relative to the capital employed in the business. Analysts use this formula to calculate it for ANSYS:
Return on Capital Employed = Earnings Before Interest and Tax (EBIT) ÷ (Total Assets - Current Liabilities)
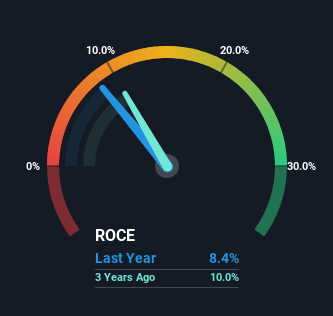
0.084 = US$542m ÷ (US$7.2b - US$707m) (Based on the trailing twelve months to March 2024).
Therefore, ANSYS has an ROCE of 8.4%. In absolute terms, that's a low return but it's around the Software industry average of 7.2%.
Check out our latest analysis for ANSYS
Above you can see how the current ROCE for ANSYS compares to its prior returns on capital, but there's only so much you can tell from the past. If you're interested, you can view the analysts predictions in our free analyst report for ANSYS .
What Does the ROCE Trend For ANSYS Tell Us?
In terms of ANSYS' historical ROCE movements, the trend isn't fantastic. Around five years ago the returns on capital were 17%, but since then they've fallen to 8.4%. Meanwhile, the business is utilizing more capital but this hasn't moved the needle much in terms of sales in the past 12 months, so this could reflect longer term investments. It's worth keeping an eye on the company's earnings from here on to see if these investments do end up contributing to the bottom line.
The Bottom Line
Bringing it all together, while we're somewhat encouraged by ANSYS' reinvestment in its own business, we're aware that returns are shrinking. Since the stock has gained an impressive 63% over the last five years, investors must think there's better things to come. Ultimately, if the underlying trends persist, we wouldn't hold our breath on it being a multi-bagger going forward.
While ANSYS doesn't shine too bright in this respect, it's still worth seeing if the company is trading at attractive prices. You can find that out with our FREE intrinsic value estimation for ANSS on our platform.
If you want to search for solid companies with great earnings, check out this free list of companies with good balance sheets and impressive returns on equity.
Have feedback on this article? Concerned about the content? Get in touch with us directly. Alternatively, email editorial-team (at) simplywallst.com.
This article by Simply Wall St is general in nature. We provide commentary based on historical data and analyst forecasts only using an unbiased methodology and our articles are not intended to be financial advice. It does not constitute a recommendation to buy or sell any stock, and does not take account of your objectives, or your financial situation. We aim to bring you long-term focused analysis driven by fundamental data. Note that our analysis may not factor in the latest price-sensitive company announcements or qualitative material. Simply Wall St has no position in any stocks mentioned.
