
 Yahoo Finance
 Investing in International Money Express (NASDAQ:IMXI) five years ago would have delivered you a 42% gain
If you buy and hold a stock for many years, you'd hope to be making a profit. Furthermore, you'd generally like to see the share price rise faster than the market. Unfortunately for shareholders, while the International Money Express, Inc. (NASDAQ:IMXI) share price is up 42% in the last five years, that's less than the market return. Zooming in, the stock is actually down 17% in the last year.
So let's assess the underlying fundamentals over the last 5 years and see if they've moved in lock-step with shareholder returns.
See our latest analysis for International Money Express
While the efficient markets hypothesis continues to be taught by some, it has been proven that markets are over-reactive dynamic systems, and investors are not always rational. By comparing earnings per share (EPS) and share price changes over time, we can get a feel for how investor attitudes to a company have morphed over time.
During the five years of share price growth, International Money Express moved from a loss to profitability. That would generally be considered a positive, so we'd hope to see the share price to rise. Given that the company made a profit three years ago, but not five years ago, it is worth looking at the share price returns over the last three years, too. Indeed, the International Money Express share price has gained 34% in three years. During the same period, EPS grew by 24% each year. This EPS growth is higher than the 10% average annual increase in the share price over the same three years. So you might conclude the market is a little more cautious about the stock, these days. This unenthusiastic sentiment is reflected in the stock's reasonably modest P/E ratio of 11.18.
You can see how EPS has changed over time in the image below (click on the chart to see the exact values).
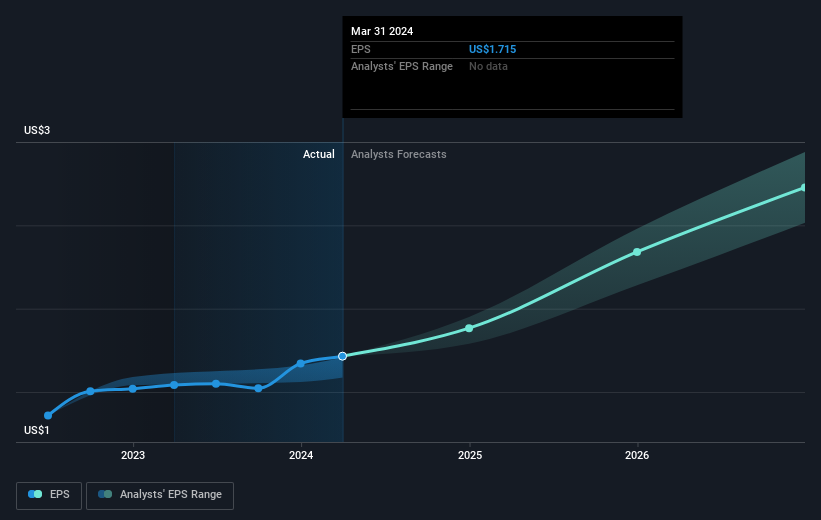
We know that International Money Express has improved its bottom line lately, but is it going to grow revenue? If you're interested, you could check this free report showing consensus revenue forecasts.
A Different Perspective
While the broader market gained around 24% in the last year, International Money Express shareholders lost 17%. Even the share prices of good stocks drop sometimes, but we want to see improvements in the fundamental metrics of a business, before getting too interested. On the bright side, long term shareholders have made money, with a gain of 7% per year over half a decade. If the fundamental data continues to indicate long term sustainable growth, the current sell-off could be an opportunity worth considering. Before forming an opinion on International Money Express you might want to consider these 3 valuation metrics.
Of course International Money Express may not be the best stock to buy. So you may wish to see this free collection of growth stocks.
Please note, the market returns quoted in this article reflect the market weighted average returns of stocks that currently trade on American exchanges.
Have feedback on this article? Concerned about the content? Get in touch with us directly. Alternatively, email editorial-team (at) simplywallst.com.
This article by Simply Wall St is general in nature. We provide commentary based on historical data and analyst forecasts only using an unbiased methodology and our articles are not intended to be financial advice. It does not constitute a recommendation to buy or sell any stock, and does not take account of your objectives, or your financial situation. We aim to bring you long-term focused analysis driven by fundamental data. Note that our analysis may not factor in the latest price-sensitive company announcements or qualitative material. Simply Wall St has no position in any stocks mentioned.
Have feedback on this article? Concerned about the content? Get in touch with us directly. Alternatively, email editorial-team@simplywallst.com
