
 Yahoo Finance
 There Are Reasons To Feel Uneasy About Vulcan Steel's (ASX:VSL) Returns On Capital
If we want to find a potential multi-bagger, often there are underlying trends that can provide clues. Amongst other things, we'll want to see two things; firstly, a growing return on capital employed (ROCE) and secondly, an expansion in the company's amount of capital employed. This shows us that it's a compounding machine, able to continually reinvest its earnings back into the business and generate higher returns. Having said that, from a first glance at Vulcan Steel (ASX:VSL) we aren't jumping out of our chairs at how returns are trending, but let's have a deeper look.
Understanding Return On Capital Employed (ROCE)
For those that aren't sure what ROCE is, it measures the amount of pre-tax profits a company can generate from the capital employed in its business. To calculate this metric for Vulcan Steel, this is the formula:
Return on Capital Employed = Earnings Before Interest and Tax (EBIT) ÷ (Total Assets - Current Liabilities)
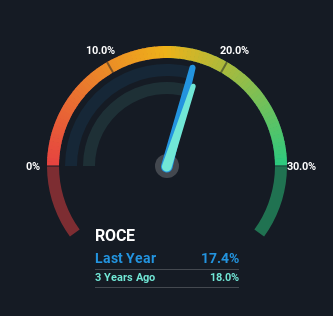
0.17 = NZ$128m ÷ (NZ$908m - NZ$171m) (Based on the trailing twelve months to December 2023).
Thus, Vulcan Steel has an ROCE of 17%. In absolute terms, that's a satisfactory return, but compared to the Metals and Mining industry average of 11% it's much better.
Check out our latest analysis for Vulcan Steel
In the above chart we have measured Vulcan Steel's prior ROCE against its prior performance, but the future is arguably more important. If you'd like, you can check out the forecasts from the analysts covering Vulcan Steel for free.
What Does the ROCE Trend For Vulcan Steel Tell Us?
In terms of Vulcan Steel's historical ROCE movements, the trend isn't fantastic. Around five years ago the returns on capital were 25%, but since then they've fallen to 17%. However it looks like Vulcan Steel might be reinvesting for long term growth because while capital employed has increased, the company's sales haven't changed much in the last 12 months. It may take some time before the company starts to see any change in earnings from these investments.
On a related note, Vulcan Steel has decreased its current liabilities to 19% of total assets. So we could link some of this to the decrease in ROCE. Effectively this means their suppliers or short-term creditors are funding less of the business, which reduces some elements of risk. Since the business is basically funding more of its operations with it's own money, you could argue this has made the business less efficient at generating ROCE.
The Key Takeaway
Bringing it all together, while we're somewhat encouraged by Vulcan Steel's reinvestment in its own business, we're aware that returns are shrinking. Although the market must be expecting these trends to improve because the stock has gained 16% over the last year. Ultimately, if the underlying trends persist, we wouldn't hold our breath on it being a multi-bagger going forward.
On a final note, we've found 3 warning signs for Vulcan Steel that we think you should be aware of.
For those who like to invest in solid companies, check out this free list of companies with solid balance sheets and high returns on equity.
Have feedback on this article? Concerned about the content? Get in touch with us directly. Alternatively, email editorial-team (at) simplywallst.com.
This article by Simply Wall St is general in nature. We provide commentary based on historical data and analyst forecasts only using an unbiased methodology and our articles are not intended to be financial advice. It does not constitute a recommendation to buy or sell any stock, and does not take account of your objectives, or your financial situation. We aim to bring you long-term focused analysis driven by fundamental data. Note that our analysis may not factor in the latest price-sensitive company announcements or qualitative material. Simply Wall St has no position in any stocks mentioned.
