
 Yahoo Finance
 Reckitt Benckiser Group (LON:RKT) Shareholders Will Want The ROCE Trajectory To Continue
If we want to find a stock that could multiply over the long term, what are the underlying trends we should look for? Ideally, a business will show two trends; firstly a growing return on capital employed (ROCE) and secondly, an increasing amount of capital employed. Put simply, these types of businesses are compounding machines, meaning they are continually reinvesting their earnings at ever-higher rates of return. Speaking of which, we noticed some great changes in Reckitt Benckiser Group's (LON:RKT) returns on capital, so let's have a look.
What Is Return On Capital Employed (ROCE)?
If you haven't worked with ROCE before, it measures the 'return' (pre-tax profit) a company generates from capital employed in its business. The formula for this calculation on Reckitt Benckiser Group is:
Return on Capital Employed = Earnings Before Interest and Tax (EBIT) ÷ (Total Assets - Current Liabilities)
0.18 = UK£3.3b ÷ (UK£27b - UK£8.3b) (Based on the trailing twelve months to December 2023).
Therefore, Reckitt Benckiser Group has an ROCE of 18%. On its own, that's a standard return, however it's much better than the 13% generated by the Household Products industry.
See our latest analysis for Reckitt Benckiser Group
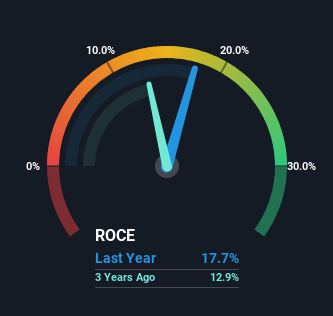
Above you can see how the current ROCE for Reckitt Benckiser Group compares to its prior returns on capital, but there's only so much you can tell from the past. If you'd like to see what analysts are forecasting going forward, you should check out our free analyst report for Reckitt Benckiser Group .
What Can We Tell From Reckitt Benckiser Group's ROCE Trend?
We're pretty happy with how the ROCE has been trending at Reckitt Benckiser Group. We found that the returns on capital employed over the last five years have risen by 59%. The company is now earning UK£0.2 per dollar of capital employed. Interestingly, the business may be becoming more efficient because it's applying 38% less capital than it was five years ago. Reckitt Benckiser Group may be selling some assets so it's worth investigating if the business has plans for future investments to increase returns further still.
On a side note, we noticed that the improvement in ROCE appears to be partly fueled by an increase in current liabilities. The current liabilities has increased to 31% of total assets, so the business is now more funded by the likes of its suppliers or short-term creditors. Keep an eye out for future increases because when the ratio of current liabilities to total assets gets particularly high, this can introduce some new risks for the business.
The Key Takeaway
From what we've seen above, Reckitt Benckiser Group has managed to increase it's returns on capital all the while reducing it's capital base. Given the stock has declined 21% in the last five years, this could be a good investment if the valuation and other metrics are also appealing. That being the case, research into the company's current valuation metrics and future prospects seems fitting.
If you want to continue researching Reckitt Benckiser Group, you might be interested to know about the 3 warning signs that our analysis has discovered.
While Reckitt Benckiser Group isn't earning the highest return, check out this free list of companies that are earning high returns on equity with solid balance sheets.
Have feedback on this article? Concerned about the content? Get in touch with us directly. Alternatively, email editorial-team (at) simplywallst.com.
This article by Simply Wall St is general in nature. We provide commentary based on historical data and analyst forecasts only using an unbiased methodology and our articles are not intended to be financial advice. It does not constitute a recommendation to buy or sell any stock, and does not take account of your objectives, or your financial situation. We aim to bring you long-term focused analysis driven by fundamental data. Note that our analysis may not factor in the latest price-sensitive company announcements or qualitative material. Simply Wall St has no position in any stocks mentioned.
