
 Yahoo Finance
 The Return Trends At Overstock.com (NASDAQ:OSTK) Look Promising
What trends should we look for it we want to identify stocks that can multiply in value over the long term? Amongst other things, we'll want to see two things; firstly, a growing return on capital employed (ROCE) and secondly, an expansion in the company's amount of capital employed. Basically this means that a company has profitable initiatives that it can continue to reinvest in, which is a trait of a compounding machine. With that in mind, we've noticed some promising trends at Overstock.com (NASDAQ:OSTK) so let's look a bit deeper.
Return On Capital Employed (ROCE): What Is It?
Just to clarify if you're unsure, ROCE is a metric for evaluating how much pre-tax income (in percentage terms) a company earns on the capital invested in its business. The formula for this calculation on Overstock.com is:
Return on Capital Employed = Earnings Before Interest and Tax (EBIT) ÷ (Total Assets - Current Liabilities)
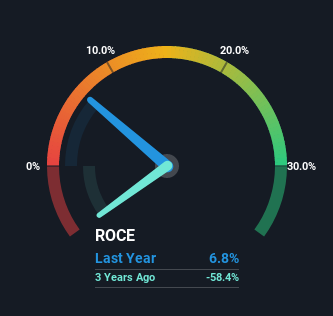
0.068 = US$49m ÷ (US$952m - US$233m) (Based on the trailing twelve months to September 2022).
Thus, Overstock.com has an ROCE of 6.8%. In absolute terms, that's a low return and it also under-performs the Online Retail industry average of 9.6%.
See our latest analysis for Overstock.com
In the above chart we have measured Overstock.com's prior ROCE against its prior performance, but the future is arguably more important. If you'd like to see what analysts are forecasting going forward, you should check out our free report for Overstock.com.
What Can We Tell From Overstock.com's ROCE Trend?
Overstock.com has recently broken into profitability so their prior investments seem to be paying off. About five years ago the company was generating losses but things have turned around because it's now earning 6.8% on its capital. Not only that, but the company is utilizing 227% more capital than before, but that's to be expected from a company trying to break into profitability. We like this trend, because it tells us the company has profitable reinvestment opportunities available to it, and if it continues going forward that can lead to a multi-bagger performance.
One more thing to note, Overstock.com has decreased current liabilities to 24% of total assets over this period, which effectively reduces the amount of funding from suppliers or short-term creditors. This tells us that Overstock.com has grown its returns without a reliance on increasing their current liabilities, which we're very happy with.
The Key Takeaway
In summary, it's great to see that Overstock.com has managed to break into profitability and is continuing to reinvest in its business. Astute investors may have an opportunity here because the stock has declined 64% in the last five years. With that in mind, we believe the promising trends warrant this stock for further investigation.
One more thing to note, we've identified 3 warning signs with Overstock.com and understanding them should be part of your investment process.
While Overstock.com isn't earning the highest return, check out this free list of companies that are earning high returns on equity with solid balance sheets.
Have feedback on this article? Concerned about the content? Get in touch with us directly. Alternatively, email editorial-team (at) simplywallst.com.
This article by Simply Wall St is general in nature. We provide commentary based on historical data and analyst forecasts only using an unbiased methodology and our articles are not intended to be financial advice. It does not constitute a recommendation to buy or sell any stock, and does not take account of your objectives, or your financial situation. We aim to bring you long-term focused analysis driven by fundamental data. Note that our analysis may not factor in the latest price-sensitive company announcements or qualitative material. Simply Wall St has no position in any stocks mentioned.
Join A Paid User Research Session
You’ll receive a US$30 Amazon Gift card for 1 hour of your time while helping us build better investing tools for the individual investors like yourself. Sign up here
