
 Yahoo Finance
 Returns On Capital At Edison International (NYSE:EIX) Have Hit The Brakes
There are a few key trends to look for if we want to identify the next multi-bagger. Firstly, we'd want to identify a growing return on capital employed (ROCE) and then alongside that, an ever-increasing base of capital employed. If you see this, it typically means it's a company with a great business model and plenty of profitable reinvestment opportunities. Although, when we looked at Edison International (NYSE:EIX), it didn't seem to tick all of these boxes.
What Is Return On Capital Employed (ROCE)?
For those that aren't sure what ROCE is, it measures the amount of pre-tax profits a company can generate from the capital employed in its business. To calculate this metric for Edison International, this is the formula:
Return on Capital Employed = Earnings Before Interest and Tax (EBIT) ÷ (Total Assets - Current Liabilities)
0.049 = US$3.7b ÷ (US$84b - US$7.9b) (Based on the trailing twelve months to March 2024).
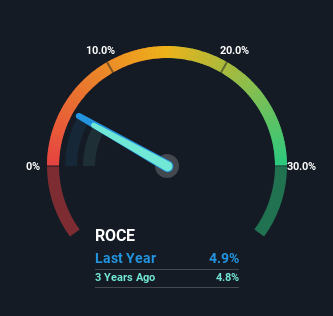
Therefore, Edison International has an ROCE of 4.9%. Even though it's in line with the industry average of 4.8%, it's still a low return by itself.
See our latest analysis for Edison International
In the above chart we have measured Edison International's prior ROCE against its prior performance, but the future is arguably more important. If you're interested, you can view the analysts predictions in our free analyst report for Edison International .
The Trend Of ROCE
There are better returns on capital out there than what we're seeing at Edison International. The company has consistently earned 4.9% for the last five years, and the capital employed within the business has risen 42% in that time. Given the company has increased the amount of capital employed, it appears the investments that have been made simply don't provide a high return on capital.
What We Can Learn From Edison International's ROCE
In summary, Edison International has simply been reinvesting capital and generating the same low rate of return as before. Unsurprisingly, the stock has only gained 36% over the last five years, which potentially indicates that investors are accounting for this going forward. So if you're looking for a multi-bagger, the underlying trends indicate you may have better chances elsewhere.
If you want to know some of the risks facing Edison International we've found 3 warning signs (2 shouldn't be ignored!) that you should be aware of before investing here.
For those who like to invest in solid companies, check out this free list of companies with solid balance sheets and high returns on equity.
Have feedback on this article? Concerned about the content? Get in touch with us directly. Alternatively, email editorial-team (at) simplywallst.com.
This article by Simply Wall St is general in nature. We provide commentary based on historical data and analyst forecasts only using an unbiased methodology and our articles are not intended to be financial advice. It does not constitute a recommendation to buy or sell any stock, and does not take account of your objectives, or your financial situation. We aim to bring you long-term focused analysis driven by fundamental data. Note that our analysis may not factor in the latest price-sensitive company announcements or qualitative material. Simply Wall St has no position in any stocks mentioned.
Have feedback on this article? Concerned about the content? Get in touch with us directly. Alternatively, email editorial-team@simplywallst.com
