
 Yahoo Finance
 Returns On Capital Signal Difficult Times Ahead For Evonik Industries (ETR:EVK)
When researching a stock for investment, what can tell us that the company is in decline? More often than not, we'll see a declining return on capital employed (ROCE) and a declining amount of capital employed. This combination can tell you that not only is the company investing less, it's earning less on what it does invest. On that note, looking into Evonik Industries (ETR:EVK), we weren't too upbeat about how things were going.
Understanding Return On Capital Employed (ROCE)
Just to clarify if you're unsure, ROCE is a metric for evaluating how much pre-tax income (in percentage terms) a company earns on the capital invested in its business. To calculate this metric for Evonik Industries, this is the formula:
Return on Capital Employed = Earnings Before Interest and Tax (EBIT) ÷ (Total Assets - Current Liabilities)
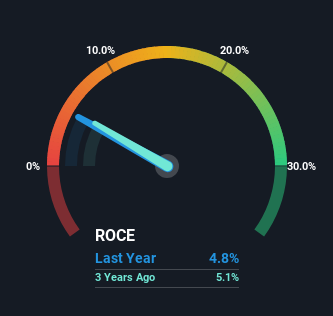
0.048 = €775m ÷ (€20b - €4.3b) (Based on the trailing twelve months to March 2024).
So, Evonik Industries has an ROCE of 4.8%. Ultimately, that's a low return and it under-performs the Chemicals industry average of 7.8%.
See our latest analysis for Evonik Industries
In the above chart we have measured Evonik Industries' prior ROCE against its prior performance, but the future is arguably more important. If you'd like, you can check out the forecasts from the analysts covering Evonik Industries for free.
How Are Returns Trending?
We are a bit worried about the trend of returns on capital at Evonik Industries. About five years ago, returns on capital were 7.4%, however they're now substantially lower than that as we saw above. And on the capital employed front, the business is utilizing roughly the same amount of capital as it was back then. Since returns are falling and the business has the same amount of assets employed, this can suggest it's a mature business that hasn't had much growth in the last five years. So because these trends aren't typically conducive to creating a multi-bagger, we wouldn't hold our breath on Evonik Industries becoming one if things continue as they have.
The Bottom Line
In summary, it's unfortunate that Evonik Industries is generating lower returns from the same amount of capital. In spite of that, the stock has delivered a 1.2% return to shareholders who held over the last five years. Regardless, we don't like the trends as they are and if they persist, we think you might find better investments elsewhere.
If you'd like to know about the risks facing Evonik Industries, we've discovered 1 warning sign that you should be aware of.
If you want to search for solid companies with great earnings, check out this free list of companies with good balance sheets and impressive returns on equity.
Have feedback on this article? Concerned about the content? Get in touch with us directly. Alternatively, email editorial-team (at) simplywallst.com.
This article by Simply Wall St is general in nature. We provide commentary based on historical data and analyst forecasts only using an unbiased methodology and our articles are not intended to be financial advice. It does not constitute a recommendation to buy or sell any stock, and does not take account of your objectives, or your financial situation. We aim to bring you long-term focused analysis driven by fundamental data. Note that our analysis may not factor in the latest price-sensitive company announcements or qualitative material. Simply Wall St has no position in any stocks mentioned.
