
 Yahoo Finance
 Returns At Phillips 66 (NYSE:PSX) Are On The Way Up
If we want to find a stock that could multiply over the long term, what are the underlying trends we should look for? Typically, we'll want to notice a trend of growing return on capital employed (ROCE) and alongside that, an expanding base of capital employed. Put simply, these types of businesses are compounding machines, meaning they are continually reinvesting their earnings at ever-higher rates of return. Speaking of which, we noticed some great changes in Phillips 66's (NYSE:PSX) returns on capital, so let's have a look.
Understanding Return On Capital Employed (ROCE)
For those who don't know, ROCE is a measure of a company's yearly pre-tax profit (its return), relative to the capital employed in the business. Analysts use this formula to calculate it for Phillips 66:
Return on Capital Employed = Earnings Before Interest and Tax (EBIT) ÷ (Total Assets - Current Liabilities)
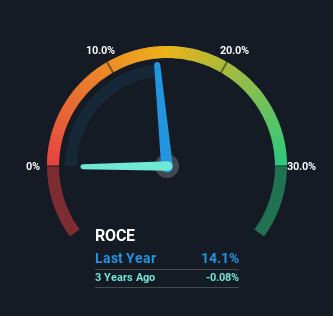
0.14 = US$8.5b ÷ (US$78b - US$17b) (Based on the trailing twelve months to September 2023).
Therefore, Phillips 66 has an ROCE of 14%. That's a relatively normal return on capital, and it's around the 17% generated by the Oil and Gas industry.
Check out our latest analysis for Phillips 66
Above you can see how the current ROCE for Phillips 66 compares to its prior returns on capital, but there's only so much you can tell from the past. If you'd like, you can check out the forecasts from the analysts covering Phillips 66 here for free.
The Trend Of ROCE
The trends we've noticed at Phillips 66 are quite reassuring. The data shows that returns on capital have increased substantially over the last five years to 14%. Basically the business is earning more per dollar of capital invested and in addition to that, 37% more capital is being employed now too. So we're very much inspired by what we're seeing at Phillips 66 thanks to its ability to profitably reinvest capital.
In Conclusion...
In summary, it's great to see that Phillips 66 can compound returns by consistently reinvesting capital at increasing rates of return, because these are some of the key ingredients of those highly sought after multi-baggers. Since the stock has returned a solid 78% to shareholders over the last five years, it's fair to say investors are beginning to recognize these changes. So given the stock has proven it has promising trends, it's worth researching the company further to see if these trends are likely to persist.
If you'd like to know more about Phillips 66, we've spotted 2 warning signs, and 1 of them is concerning.
If you want to search for solid companies with great earnings, check out this free list of companies with good balance sheets and impressive returns on equity.
Have feedback on this article? Concerned about the content? Get in touch with us directly. Alternatively, email editorial-team (at) simplywallst.com.
This article by Simply Wall St is general in nature. We provide commentary based on historical data and analyst forecasts only using an unbiased methodology and our articles are not intended to be financial advice. It does not constitute a recommendation to buy or sell any stock, and does not take account of your objectives, or your financial situation. We aim to bring you long-term focused analysis driven by fundamental data. Note that our analysis may not factor in the latest price-sensitive company announcements or qualitative material. Simply Wall St has no position in any stocks mentioned.
