
 Yahoo Finance
 Roebuck Food Group (LON:RFG) shareholders have earned a 17% CAGR over the last three years
No-one enjoys it when they lose money on a stock. But when the market is down, you're bound to have some losers. The Roebuck Food Group plc (LON:RFG) is down 92% over three years, but the total shareholder return is 62% once you include the dividend. That's better than the market which returned 19% over the last three years. We really hope anyone holding through that price crash has a diversified portfolio. Even when you lose money, you don't have to lose the lesson.
So let's have a look and see if the longer term performance of the company has been in line with the underlying business' progress.
View our latest analysis for Roebuck Food Group
Roebuck Food Group isn't currently profitable, so most analysts would look to revenue growth to get an idea of how fast the underlying business is growing. When a company doesn't make profits, we'd generally hope to see good revenue growth. That's because fast revenue growth can be easily extrapolated to forecast profits, often of considerable size.
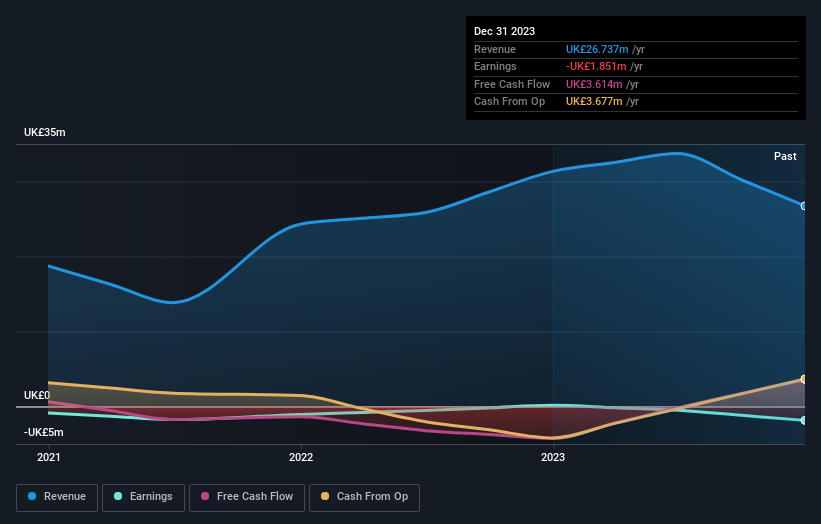
In the last three years, Roebuck Food Group saw its revenue grow by 21% per year, compound. That's well above most other pre-profit companies. So why has the share priced crashed 24% per year, in the same time? The share price makes us wonder if there is an issue with profitability. Sometimes fast revenue growth doesn't lead to profits. If the company is low on cash, it may have to raise capital soon.
You can see below how earnings and revenue have changed over time (discover the exact values by clicking on the image).
You can see how its balance sheet has strengthened (or weakened) over time in this free interactive graphic.
A Dividend Lost
The share price return figures discussed above don't include the value of dividends paid previously, but the total shareholder return (TSR) does. In some ways, TSR is a better measure of how well an investment has performed. Over the last 3 years, Roebuck Food Group generated a TSR of 62%, which is, of course, better than the share price return. Although the company had to cut dividends, it has paid cash to shareholders in the past.
A Different Perspective
Roebuck Food Group shareholders are down 18% for the year, but the market itself is up 12%. Even the share prices of good stocks drop sometimes, but we want to see improvements in the fundamental metrics of a business, before getting too interested. Longer term investors wouldn't be so upset, since they would have made 31%, each year, over five years. It could be that the recent sell-off is an opportunity, so it may be worth checking the fundamental data for signs of a long term growth trend. It's always interesting to track share price performance over the longer term. But to understand Roebuck Food Group better, we need to consider many other factors. For instance, we've identified 3 warning signs for Roebuck Food Group that you should be aware of.
If you are like me, then you will not want to miss this free list of undervalued small caps that insiders are buying.
Please note, the market returns quoted in this article reflect the market weighted average returns of stocks that currently trade on British exchanges.
Have feedback on this article? Concerned about the content? Get in touch with us directly. Alternatively, email editorial-team (at) simplywallst.com.
This article by Simply Wall St is general in nature. We provide commentary based on historical data and analyst forecasts only using an unbiased methodology and our articles are not intended to be financial advice. It does not constitute a recommendation to buy or sell any stock, and does not take account of your objectives, or your financial situation. We aim to bring you long-term focused analysis driven by fundamental data. Note that our analysis may not factor in the latest price-sensitive company announcements or qualitative material. Simply Wall St has no position in any stocks mentioned.
