
 Yahoo Finance
 Shareholders Are Optimistic That Paychex (NASDAQ:PAYX) Will Multiply In Value
If you're not sure where to start when looking for the next multi-bagger, there are a few key trends you should keep an eye out for. In a perfect world, we'd like to see a company investing more capital into its business and ideally the returns earned from that capital are also increasing. If you see this, it typically means it's a company with a great business model and plenty of profitable reinvestment opportunities. That's why when we briefly looked at Paychex's (NASDAQ:PAYX) ROCE trend, we were very happy with what we saw.
Understanding Return On Capital Employed (ROCE)
Just to clarify if you're unsure, ROCE is a metric for evaluating how much pre-tax income (in percentage terms) a company earns on the capital invested in its business. The formula for this calculation on Paychex is:
Return on Capital Employed = Earnings Before Interest and Tax (EBIT) ÷ (Total Assets - Current Liabilities)
0.43 = US$2.1b ÷ (US$13b - US$8.0b) (Based on the trailing twelve months to February 2024).
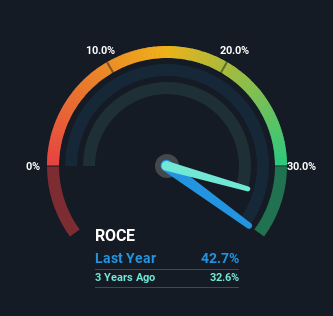
Thus, Paychex has an ROCE of 43%. In absolute terms that's a great return and it's even better than the Professional Services industry average of 14%.
View our latest analysis for Paychex
Above you can see how the current ROCE for Paychex compares to its prior returns on capital, but there's only so much you can tell from the past. If you'd like to see what analysts are forecasting going forward, you should check out our free analyst report for Paychex .
The Trend Of ROCE
In terms of Paychex's history of ROCE, it's quite impressive. The company has employed 32% more capital in the last five years, and the returns on that capital have remained stable at 43%. With returns that high, it's great that the business can continually reinvest its money at such appealing rates of return. If these trends can continue, it wouldn't surprise us if the company became a multi-bagger.
On a separate but related note, it's important to know that Paychex has a current liabilities to total assets ratio of 61%, which we'd consider pretty high. This can bring about some risks because the company is basically operating with a rather large reliance on its suppliers or other sorts of short-term creditors. While it's not necessarily a bad thing, it can be beneficial if this ratio is lower.
The Bottom Line On Paychex's ROCE
In short, we'd argue Paychex has the makings of a multi-bagger since its been able to compound its capital at very profitable rates of return. And the stock has followed suit returning a meaningful 73% to shareholders over the last five years. So while the positive underlying trends may be accounted for by investors, we still think this stock is worth looking into further.
Before jumping to any conclusions though, we need to know what value we're getting for the current share price. That's where you can check out our FREE intrinsic value estimation for PAYX that compares the share price and estimated value.
Paychex is not the only stock earning high returns. If you'd like to see more, check out our free list of companies earning high returns on equity with solid fundamentals.
Have feedback on this article? Concerned about the content? Get in touch with us directly. Alternatively, email editorial-team (at) simplywallst.com.
This article by Simply Wall St is general in nature. We provide commentary based on historical data and analyst forecasts only using an unbiased methodology and our articles are not intended to be financial advice. It does not constitute a recommendation to buy or sell any stock, and does not take account of your objectives, or your financial situation. We aim to bring you long-term focused analysis driven by fundamental data. Note that our analysis may not factor in the latest price-sensitive company announcements or qualitative material. Simply Wall St has no position in any stocks mentioned.
Have feedback on this article? Concerned about the content? Get in touch with us directly. Alternatively, email editorial-team@simplywallst.com
