
 Yahoo Finance
 Shougang Fushan Resources Group And Two More High Dividend Stocks To Consider
Amidst a backdrop of fluctuating global markets, with the Hang Seng Index recently experiencing a notable decline, investors might find refuge in high dividend stocks. These stocks can offer potential stability and regular income, qualities that are particularly appealing in uncertain economic times such as these.
Top 10 Dividend Stocks In Hong Kong
Name | Dividend Yield | Dividend Rating |
Chongqing Rural Commercial Bank (SEHK:3618) | 8.13% | ★★★★★★ |
CITIC Telecom International Holdings (SEHK:1883) | 9.84% | ★★★★★★ |
Consun Pharmaceutical Group (SEHK:1681) | 8.94% | ★★★★★☆ |
China Electronics Huada Technology (SEHK:85) | 8.02% | ★★★★★☆ |
S.A.S. Dragon Holdings (SEHK:1184) | 9.33% | ★★★★★☆ |
Bank of China (SEHK:3988) | 6.56% | ★★★★★☆ |
China Mobile (SEHK:941) | 6.55% | ★★★★★☆ |
Sinopharm Group (SEHK:1099) | 4.15% | ★★★★★☆ |
International Housewares Retail (SEHK:1373) | 8.48% | ★★★★★☆ |
China Overseas Grand Oceans Group (SEHK:81) | 7.58% | ★★★★★☆ |
Click here to see the full list of 91 stocks from our Top Dividend Stocks screener.
Let's uncover some gems from our specialized screener.
Shougang Fushan Resources Group
Simply Wall St Dividend Rating: ★★★★★☆
Overview: Shougang Fushan Resources Group Limited operates primarily in the raw coal mining, processing, and sales of both raw and clean coal within the People's Republic of China, with a market capitalization of approximately HK$16.80 billion.
Operations: Shougang Fushan Resources Group Limited generates revenue primarily from its coking coal mining segment, totaling approximately HK$5.89 billion.
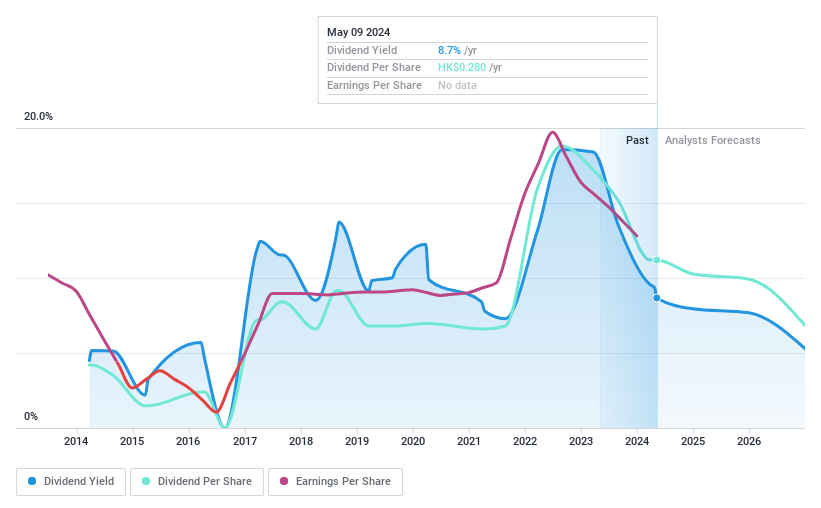
Dividend Yield: 8.2%
Shougang Fushan Resources Group recently proposed a final dividend of HK$0.18 per share, reflecting a cautious approach amid declining earnings, with sales dropping to HK$5.89 billion and net income to HK$1.89 billion in 2023 from higher levels the previous year. Despite a historically volatile dividend track record, the company maintains a reasonable payout ratio of 74.4% and cash payout ratio of 34.2%, suggesting that current dividends are well-supported by earnings and cash flow, though future growth remains uncertain with expected earnings decline.
Xingfa Aluminium Holdings
Simply Wall St Dividend Rating: ★★★★☆☆
Overview: Xingfa Aluminium Holdings Limited is an investment holding company that manufactures and sells construction and industrial aluminum profiles in the People's Republic of China, with a market capitalization of approximately HK$3.60 billion.
Operations: Xingfa Aluminium Holdings Limited generates CN¥14.12 billion from construction aluminium profiles and CN¥2.64 billion from industrial aluminium profiles.
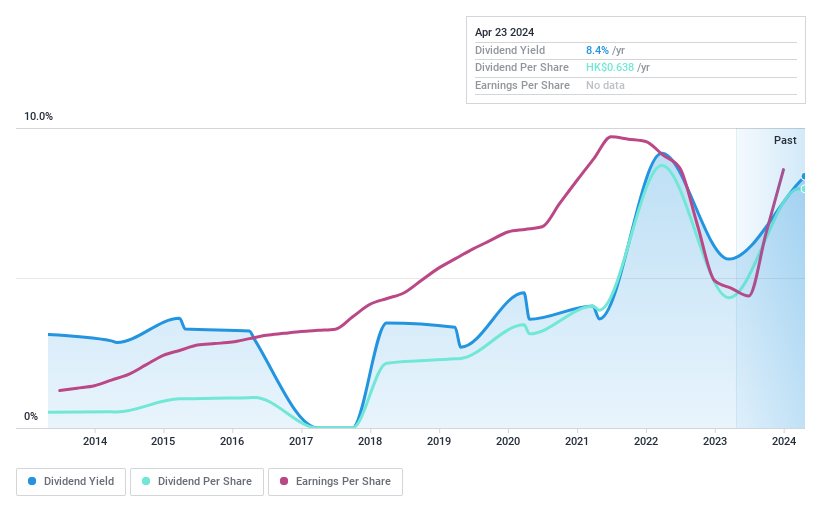
Dividend Yield: 7.4%
Xingfa Aluminium Holdings Limited recently proposed a final dividend of HK$0.64 per share, indicating confidence following a robust earnings report for 2023 with sales rising to CNY 17.35 billion and net income increasing significantly to CNY 804.17 million from CNY 457.77 million in the previous year. Despite this positive trend, the company's dividend history has been marked by inconsistency, with payments showing volatility over the past decade. Currently, dividends are reasonably covered by both earnings (30.4% payout ratio) and cash flows (51.1% cash payout ratio), but the yield of 7.44% remains slightly below the top quartile in Hong Kong's market at 7.56%.
Lenovo Group
Simply Wall St Dividend Rating: ★★★★★☆
Overview: Lenovo Group Limited is an investment holding company that develops, manufactures, and markets technology products and services, with a market capitalization of approximately HK$137.20 billion.
Operations: Lenovo Group's revenue is primarily derived from three segments: the Intelligent Devices Group (IDG) generating $44.60 billion, the Infrastructure Solutions Group (ISG) with $8.92 billion, and the Solutions and Services Group (SSG) contributing $7.47 billion.
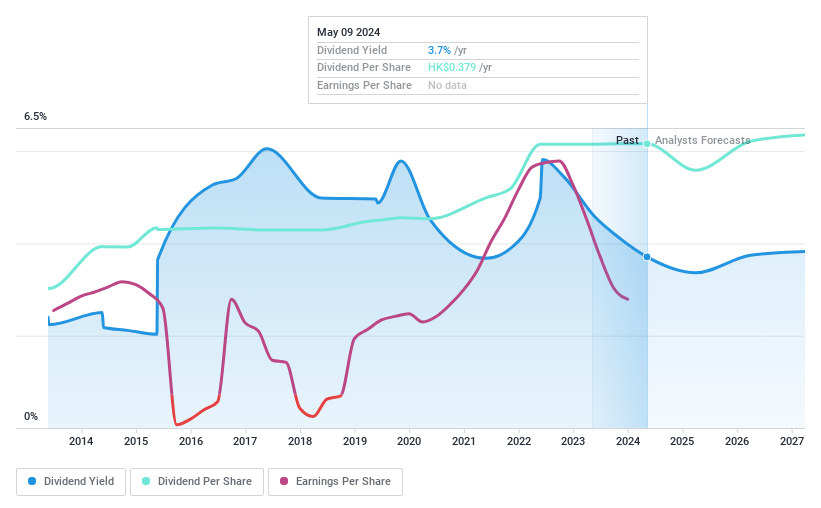
Dividend Yield: 3.4%
Lenovo Group Limited recently reported a substantial increase in quarterly earnings, with sales rising to US$13.83 billion and net income doubling to US$248 million. Despite a challenging year with overall annual sales down to US$56.86 billion and net income falling to US$1.01 billion, the company declared a final dividend of 3.8 US cents per share, affirming its commitment to shareholder returns amidst governance changes and legal challenges in Germany over patent issues. These dividends are supported by a payout ratio of 57.8% from earnings and 83.2% from cash flows, although the yield is modest at 3.44% compared to Hong Kong's top dividend payers.
Seize The Opportunity
Navigate through the entire inventory of 91 Top Dividend Stocks here.
Already own these companies? Link your portfolio to Simply Wall St and get alerts on any new warning signs to your stocks.
Simply Wall St is your key to unlocking global market trends, a free user-friendly app for forward-thinking investors.
Searching for a Fresh Perspective?
Explore high-performing small cap companies that haven't yet garnered significant analyst attention.
Fuel your portfolio with companies showing strong growth potential, backed by optimistic outlooks both from analysts and management.
Find companies with promising cash flow potential yet trading below their fair value.
This article by Simply Wall St is general in nature. We provide commentary based on historical data and analyst forecasts only using an unbiased methodology and our articles are not intended to be financial advice. It does not constitute a recommendation to buy or sell any stock, and does not take account of your objectives, or your financial situation. We aim to bring you long-term focused analysis driven by fundamental data. Note that our analysis may not factor in the latest price-sensitive company announcements or qualitative material. Simply Wall St has no position in any stocks mentioned.
Companies discussed in this article include SEHK:639 SEHK:98 and SEHK:992.
Have feedback on this article? Concerned about the content? Get in touch with us directly. Alternatively, email editorial-team@simplywallst.com
