
 Yahoo Finance
 Spire (NYSE:SR) stock falls 6.2% in past week as five-year earnings and shareholder returns continue downward trend
For many, the main point of investing is to generate higher returns than the overall market. But the main game is to find enough winners to more than offset the losers At this point some shareholders may be questioning their investment in Spire Inc. (NYSE:SR), since the last five years saw the share price fall 30%. On top of that, the share price is down 6.2% in the last week.
Given the past week has been tough on shareholders, let's investigate the fundamentals and see what we can learn.
See our latest analysis for Spire
While markets are a powerful pricing mechanism, share prices reflect investor sentiment, not just underlying business performance. One flawed but reasonable way to assess how sentiment around a company has changed is to compare the earnings per share (EPS) with the share price.
Looking back five years, both Spire's share price and EPS declined; the latter at a rate of 2.7% per year. Readers should note that the share price has fallen faster than the EPS, at a rate of 7% per year, over the period. So it seems the market was too confident about the business, in the past.
The graphic below depicts how EPS has changed over time (unveil the exact values by clicking on the image).
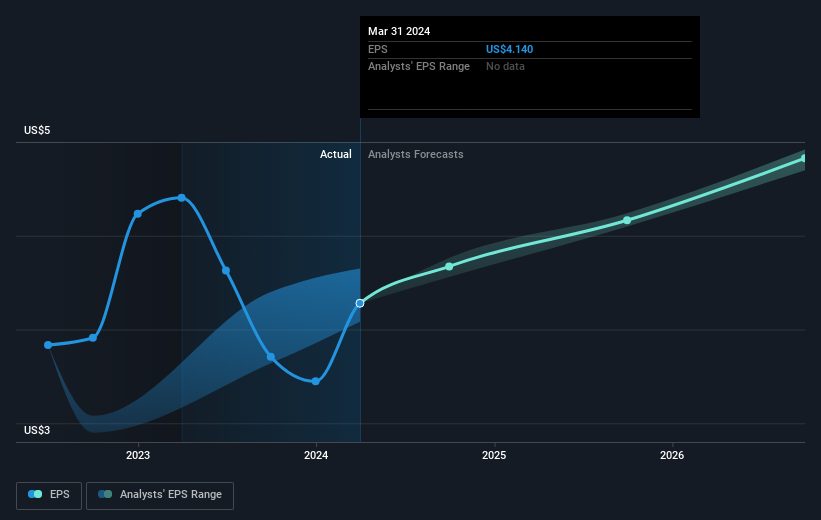
We consider it positive that insiders have made significant purchases in the last year. Even so, future earnings will be far more important to whether current shareholders make money. It might be well worthwhile taking a look at our free report on Spire's earnings, revenue and cash flow.
What About Dividends?
When looking at investment returns, it is important to consider the difference between total shareholder return (TSR) and share price return. Whereas the share price return only reflects the change in the share price, the TSR includes the value of dividends (assuming they were reinvested) and the benefit of any discounted capital raising or spin-off. Arguably, the TSR gives a more comprehensive picture of the return generated by a stock. In the case of Spire, it has a TSR of -14% for the last 5 years. That exceeds its share price return that we previously mentioned. And there's no prize for guessing that the dividend payments largely explain the divergence!
A Different Perspective
While the broader market gained around 28% in the last year, Spire shareholders lost 4.1% (even including dividends). Even the share prices of good stocks drop sometimes, but we want to see improvements in the fundamental metrics of a business, before getting too interested. Regrettably, last year's performance caps off a bad run, with the shareholders facing a total loss of 3% per year over five years. We realise that Baron Rothschild has said investors should "buy when there is blood on the streets", but we caution that investors should first be sure they are buying a high quality business. It's always interesting to track share price performance over the longer term. But to understand Spire better, we need to consider many other factors. Like risks, for instance. Every company has them, and we've spotted 3 warning signs for Spire (of which 1 doesn't sit too well with us!) you should know about.
There are plenty of other companies that have insiders buying up shares. You probably do not want to miss this free list of undervalued small cap companies that insiders are buying.
Please note, the market returns quoted in this article reflect the market weighted average returns of stocks that currently trade on American exchanges.
Have feedback on this article? Concerned about the content? Get in touch with us directly. Alternatively, email editorial-team (at) simplywallst.com.
This article by Simply Wall St is general in nature. We provide commentary based on historical data and analyst forecasts only using an unbiased methodology and our articles are not intended to be financial advice. It does not constitute a recommendation to buy or sell any stock, and does not take account of your objectives, or your financial situation. We aim to bring you long-term focused analysis driven by fundamental data. Note that our analysis may not factor in the latest price-sensitive company announcements or qualitative material. Simply Wall St has no position in any stocks mentioned.
