
 Yahoo Finance
 T. Rowe Price Group (NASDAQ:TROW) investors are sitting on a loss of 33% if they invested three years ago
In order to justify the effort of selecting individual stocks, it's worth striving to beat the returns from a market index fund. But its virtually certain that sometimes you will buy stocks that fall short of the market average returns. Unfortunately, that's been the case for longer term T. Rowe Price Group, Inc. (NASDAQ:TROW) shareholders, since the share price is down 41% in the last three years, falling well short of the market return of around 19%.
So let's have a look and see if the longer term performance of the company has been in line with the underlying business' progress.
View our latest analysis for T. Rowe Price Group
To quote Buffett, 'Ships will sail around the world but the Flat Earth Society will flourish. There will continue to be wide discrepancies between price and value in the marketplace...' One imperfect but simple way to consider how the market perception of a company has shifted is to compare the change in the earnings per share (EPS) with the share price movement.
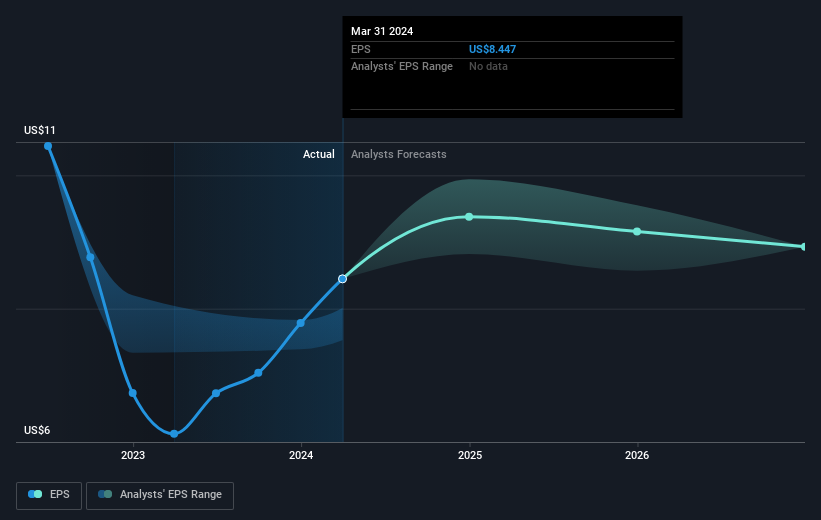
T. Rowe Price Group saw its EPS decline at a compound rate of 11% per year, over the last three years. This reduction in EPS is slower than the 16% annual reduction in the share price. So it's likely that the EPS decline has disappointed the market, leaving investors hesitant to buy.
The company's earnings per share (over time) is depicted in the image below (click to see the exact numbers).
We know that T. Rowe Price Group has improved its bottom line lately, but is it going to grow revenue? You could check out this free report showing analyst revenue forecasts.
What About Dividends?
As well as measuring the share price return, investors should also consider the total shareholder return (TSR). The TSR incorporates the value of any spin-offs or discounted capital raisings, along with any dividends, based on the assumption that the dividends are reinvested. Arguably, the TSR gives a more comprehensive picture of the return generated by a stock. We note that for T. Rowe Price Group the TSR over the last 3 years was -33%, which is better than the share price return mentioned above. This is largely a result of its dividend payments!
A Different Perspective
T. Rowe Price Group provided a TSR of 7.6% over the last twelve months. But that return falls short of the market. On the bright side, that's still a gain, and it's actually better than the average return of 5% over half a decade This could indicate that the company is winning over new investors, as it pursues its strategy. While it is well worth considering the different impacts that market conditions can have on the share price, there are other factors that are even more important. Even so, be aware that T. Rowe Price Group is showing 1 warning sign in our investment analysis , you should know about...
For those who like to find winning investments this free list of undervalued companies with recent insider purchasing, could be just the ticket.
Please note, the market returns quoted in this article reflect the market weighted average returns of stocks that currently trade on American exchanges.
Have feedback on this article? Concerned about the content? Get in touch with us directly. Alternatively, email editorial-team (at) simplywallst.com.
This article by Simply Wall St is general in nature. We provide commentary based on historical data and analyst forecasts only using an unbiased methodology and our articles are not intended to be financial advice. It does not constitute a recommendation to buy or sell any stock, and does not take account of your objectives, or your financial situation. We aim to bring you long-term focused analysis driven by fundamental data. Note that our analysis may not factor in the latest price-sensitive company announcements or qualitative material. Simply Wall St has no position in any stocks mentioned.
