
 Yahoo Finance
 Taiga Building Products (TSE:TBL) Looks To Prolong Its Impressive Returns
There are a few key trends to look for if we want to identify the next multi-bagger. Amongst other things, we'll want to see two things; firstly, a growing return on capital employed (ROCE) and secondly, an expansion in the company's amount of capital employed. This shows us that it's a compounding machine, able to continually reinvest its earnings back into the business and generate higher returns. That's why when we briefly looked at Taiga Building Products' (TSE:TBL) ROCE trend, we were very happy with what we saw.
Understanding Return On Capital Employed (ROCE)
Just to clarify if you're unsure, ROCE is a metric for evaluating how much pre-tax income (in percentage terms) a company earns on the capital invested in its business. The formula for this calculation on Taiga Building Products is:
Return on Capital Employed = Earnings Before Interest and Tax (EBIT) ÷ (Total Assets - Current Liabilities)
0.28 = CA$128m ÷ (CA$668m - CA$204m) (Based on the trailing twelve months to September 2022).
Thus, Taiga Building Products has an ROCE of 28%. In absolute terms that's a great return and it's even better than the Trade Distributors industry average of 19%.
See our latest analysis for Taiga Building Products
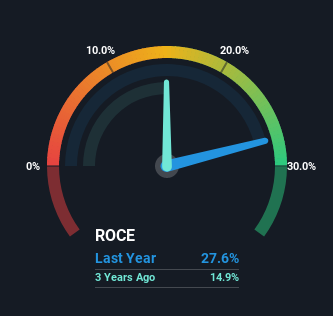
Historical performance is a great place to start when researching a stock so above you can see the gauge for Taiga Building Products' ROCE against it's prior returns. If you're interested in investigating Taiga Building Products' past further, check out this free graph of past earnings, revenue and cash flow.
What Does the ROCE Trend For Taiga Building Products Tell Us?
Taiga Building Products deserves to be commended in regards to it's returns. The company has consistently earned 28% for the last five years, and the capital employed within the business has risen 214% in that time. With returns that high, it's great that the business can continually reinvest its money at such appealing rates of return. You'll see this when looking at well operated businesses or favorable business models.
On a side note, Taiga Building Products has done well to reduce current liabilities to 31% of total assets over the last five years. Effectively suppliers now fund less of the business, which can lower some elements of risk.
What We Can Learn From Taiga Building Products' ROCE
In the end, the company has proven it can reinvest it's capital at high rates of returns, which you'll remember is a trait of a multi-bagger. And the stock has done incredibly well with a 144% return over the last five years, so long term investors are no doubt ecstatic with that result. So while the positive underlying trends may be accounted for by investors, we still think this stock is worth looking into further.
While Taiga Building Products looks impressive, no company is worth an infinite price. The intrinsic value infographic in our free research report helps visualize whether TBL is currently trading for a fair price.
If you'd like to see other companies earning high returns, check out our free list of companies earning high returns with solid balance sheets here.
Have feedback on this article? Concerned about the content? Get in touch with us directly. Alternatively, email editorial-team (at) simplywallst.com.
This article by Simply Wall St is general in nature. We provide commentary based on historical data and analyst forecasts only using an unbiased methodology and our articles are not intended to be financial advice. It does not constitute a recommendation to buy or sell any stock, and does not take account of your objectives, or your financial situation. We aim to bring you long-term focused analysis driven by fundamental data. Note that our analysis may not factor in the latest price-sensitive company announcements or qualitative material. Simply Wall St has no position in any stocks mentioned.
Join A Paid User Research Session
You’ll receive a US$30 Amazon Gift card for 1 hour of your time while helping us build better investing tools for the individual investors like yourself. Sign up here
