
 Yahoo Finance
 Those who invested in Advance Synergy Berhad (KLSE:ASB) five years ago are up 10%
Over the last month the Advance Synergy Berhad (KLSE:ASB) has been much stronger than before, rebounding by 118%.
Now let's have a look at the company's fundamentals, and see if the long term shareholder return has matched the performance of the underlying business.
Check out our latest analysis for Advance Synergy Berhad
Given that Advance Synergy Berhad didn't make a profit in the last twelve months, we'll focus on revenue growth to form a quick view of its business development. Generally speaking, companies without profits are expected to grow revenue every year, and at a good clip. That's because it's hard to be confident a company will be sustainable if revenue growth is negligible, and it never makes a profit.
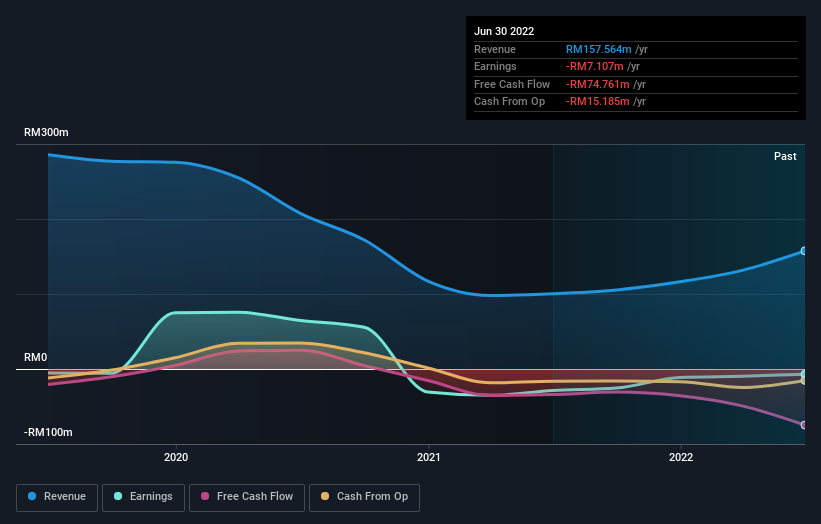
In the last five years Advance Synergy Berhad saw its revenue shrink by 19% per year. That puts it in an unattractive cohort, to put it mildly. On the face of it we'd posit the share price fall of 3% compound, over five years is well justified by the fundamental deterioration. We doubt many shareholders are delighted with this share price performance. It is possible for businesses to bounce back but as Buffett says, 'turnarounds seldom turn'.
The company's revenue and earnings (over time) are depicted in the image below (click to see the exact numbers).
This free interactive report on Advance Synergy Berhad's balance sheet strength is a great place to start, if you want to investigate the stock further.
What About Dividends?
As well as measuring the share price return, investors should also consider the total shareholder return (TSR). The TSR is a return calculation that accounts for the value of cash dividends (assuming that any dividend received was reinvested) and the calculated value of any discounted capital raisings and spin-offs. Arguably, the TSR gives a more comprehensive picture of the return generated by a stock. In the case of Advance Synergy Berhad, it has a TSR of 10% for the last 5 years. That exceeds its share price return that we previously mentioned. The dividends paid by the company have thusly boosted the total shareholder return.
A Different Perspective
It's nice to see that Advance Synergy Berhad shareholders have received a total shareholder return of 11% over the last year. That's including the dividend. That's better than the annualised return of 2% over half a decade, implying that the company is doing better recently. Someone with an optimistic perspective could view the recent improvement in TSR as indicating that the business itself is getting better with time. While it is well worth considering the different impacts that market conditions can have on the share price, there are other factors that are even more important. To that end, you should learn about the 4 warning signs we've spotted with Advance Synergy Berhad (including 3 which can't be ignored) .
But note: Advance Synergy Berhad may not be the best stock to buy. So take a peek at this free list of interesting companies with past earnings growth (and further growth forecast).
Please note, the market returns quoted in this article reflect the market weighted average returns of stocks that currently trade on MY exchanges.
Have feedback on this article? Concerned about the content? Get in touch with us directly. Alternatively, email editorial-team (at) simplywallst.com.
This article by Simply Wall St is general in nature. We provide commentary based on historical data and analyst forecasts only using an unbiased methodology and our articles are not intended to be financial advice. It does not constitute a recommendation to buy or sell any stock, and does not take account of your objectives, or your financial situation. We aim to bring you long-term focused analysis driven by fundamental data. Note that our analysis may not factor in the latest price-sensitive company announcements or qualitative material. Simply Wall St has no position in any stocks mentioned.
Join A Paid User Research Session
You’ll receive a US$30 Amazon Gift card for 1 hour of your time while helping us build better investing tools for the individual investors like yourself. Sign up here
