
 Yahoo Finance
 Those who invested in Interface (NASDAQ:TILE) a year ago are up 77%
While Interface, Inc. (NASDAQ:TILE) shareholders are probably generally happy, the stock hasn't had particularly good run recently, with the share price falling 15% in the last quarter. But that doesn't change the fact that the returns over the last year have been pleasing. In that time we've seen the stock easily surpass the market return, with a gain of 77%.
So let's investigate and see if the longer term performance of the company has been in line with the underlying business' progress.
See our latest analysis for Interface
While markets are a powerful pricing mechanism, share prices reflect investor sentiment, not just underlying business performance. One imperfect but simple way to consider how the market perception of a company has shifted is to compare the change in the earnings per share (EPS) with the share price movement.
During the last year Interface saw its earnings per share (EPS) increase strongly. This remarkable growth rate may not be sustainable, but it is still impressive. So we're unsurprised to see the share price gaining ground. Strong growth like this can be evidence of a fundamental inflection point in the business, making it a good time to investigate the stock more closely.
The graphic below depicts how EPS has changed over time (unveil the exact values by clicking on the image).
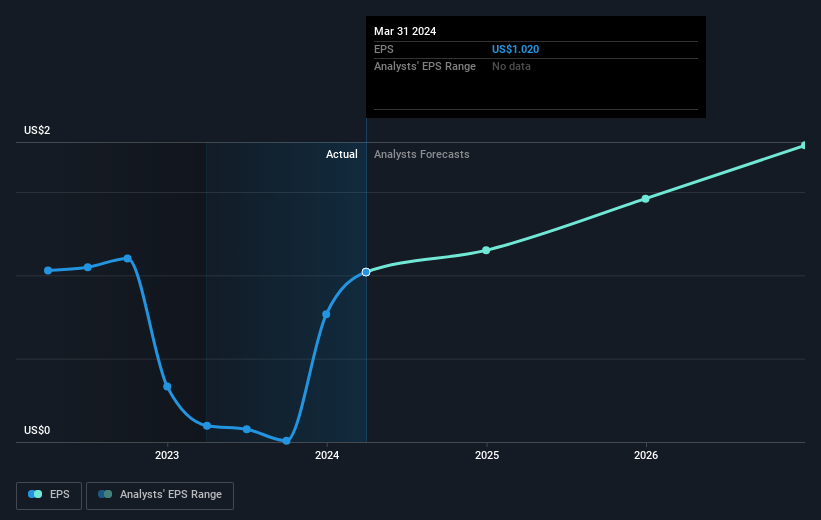
We know that Interface has improved its bottom line lately, but is it going to grow revenue? This free report showing analyst revenue forecasts should help you figure out if the EPS growth can be sustained.
A Different Perspective
It's nice to see that Interface shareholders have received a total shareholder return of 77% over the last year. Of course, that includes the dividend. There's no doubt those recent returns are much better than the TSR loss of 0.2% per year over five years. We generally put more weight on the long term performance over the short term, but the recent improvement could hint at a (positive) inflection point within the business. I find it very interesting to look at share price over the long term as a proxy for business performance. But to truly gain insight, we need to consider other information, too. To that end, you should be aware of the 2 warning signs we've spotted with Interface .
We will like Interface better if we see some big insider buys. While we wait, check out this free list of undervalued stocks (mostly small caps) with considerable, recent, insider buying.
Please note, the market returns quoted in this article reflect the market weighted average returns of stocks that currently trade on American exchanges.
Have feedback on this article? Concerned about the content? Get in touch with us directly. Alternatively, email editorial-team (at) simplywallst.com.
This article by Simply Wall St is general in nature. We provide commentary based on historical data and analyst forecasts only using an unbiased methodology and our articles are not intended to be financial advice. It does not constitute a recommendation to buy or sell any stock, and does not take account of your objectives, or your financial situation. We aim to bring you long-term focused analysis driven by fundamental data. Note that our analysis may not factor in the latest price-sensitive company announcements or qualitative material. Simply Wall St has no position in any stocks mentioned.
Have feedback on this article? Concerned about the content? Get in touch with us directly. Alternatively, email editorial-team@simplywallst.com
