
 Yahoo Finance
 Those who invested in Wacker Chemie (ETR:WCH) three years ago are up 79%
While Wacker Chemie AG (ETR:WCH) shareholders are probably generally happy, the stock hasn't had particularly good run recently, with the share price falling 22% in the last quarter. But over three years, the returns would have left most investors smiling After all, the share price is up a market-beating 67% in that time.
Let's take a look at the underlying fundamentals over the longer term, and see if they've been consistent with shareholders returns.
See our latest analysis for Wacker Chemie
There is no denying that markets are sometimes efficient, but prices do not always reflect underlying business performance. By comparing earnings per share (EPS) and share price changes over time, we can get a feel for how investor attitudes to a company have morphed over time.
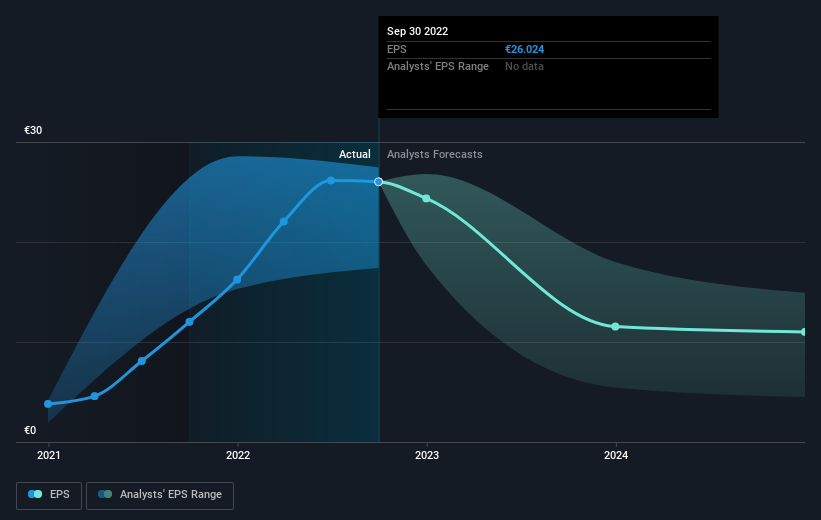
Wacker Chemie was able to grow its EPS at 112% per year over three years, sending the share price higher. The average annual share price increase of 19% is actually lower than the EPS growth. So one could reasonably conclude that the market has cooled on the stock. This cautious sentiment is reflected in its (fairly low) P/E ratio of 4.55.
You can see below how EPS has changed over time (discover the exact values by clicking on the image).
It is of course excellent to see how Wacker Chemie has grown profits over the years, but the future is more important for shareholders. You can see how its balance sheet has strengthened (or weakened) over time in this free interactive graphic.
What About Dividends?
When looking at investment returns, it is important to consider the difference between total shareholder return (TSR) and share price return. The TSR is a return calculation that accounts for the value of cash dividends (assuming that any dividend received was reinvested) and the calculated value of any discounted capital raisings and spin-offs. It's fair to say that the TSR gives a more complete picture for stocks that pay a dividend. In the case of Wacker Chemie, it has a TSR of 79% for the last 3 years. That exceeds its share price return that we previously mentioned. And there's no prize for guessing that the dividend payments largely explain the divergence!
A Different Perspective
The total return of 22% received by Wacker Chemie shareholders over the last year isn't far from the market return of -23%. Longer term investors wouldn't be so upset, since they would have made 0.1%, each year, over five years. If the fundamental data remains strong, and the share price is simply down on sentiment, then this could be an opportunity worth investigating. It's always interesting to track share price performance over the longer term. But to understand Wacker Chemie better, we need to consider many other factors. Even so, be aware that Wacker Chemie is showing 2 warning signs in our investment analysis , and 1 of those shouldn't be ignored...
Of course Wacker Chemie may not be the best stock to buy. So you may wish to see this free collection of growth stocks.
Please note, the market returns quoted in this article reflect the market weighted average returns of stocks that currently trade on DE exchanges.
Have feedback on this article? Concerned about the content? Get in touch with us directly. Alternatively, email editorial-team (at) simplywallst.com.
This article by Simply Wall St is general in nature. We provide commentary based on historical data and analyst forecasts only using an unbiased methodology and our articles are not intended to be financial advice. It does not constitute a recommendation to buy or sell any stock, and does not take account of your objectives, or your financial situation. We aim to bring you long-term focused analysis driven by fundamental data. Note that our analysis may not factor in the latest price-sensitive company announcements or qualitative material. Simply Wall St has no position in any stocks mentioned.
Join A Paid User Research Session
You’ll receive a US$30 Amazon Gift card for 1 hour of your time while helping us build better investing tools for the individual investors like yourself. Sign up here
