
 Yahoo Finance
 Top Three US Stocks Estimated Below Intrinsic Value In June 2024
As of June 2024, the U.S. stock market presents a mixed landscape, with the Dow Jones advancing while sectors like semiconductors weigh heavily on the Nasdaq. Amidst these fluctuations, identifying stocks that are potentially undervalued becomes crucial for investors looking for opportunities that may not yet reflect their intrinsic worth in their current market prices.
Top 10 Undervalued Stocks Based On Cash Flows In The United States
Name | Current Price | Fair Value (Est) | Discount (Est) |
Noble (NYSE:NE) | $44.99 | $88.34 | 49.1% |
Selective Insurance Group (NasdaqGS:SIGI) | $92.78 | $179.49 | 48.3% |
Hanover Bancorp (NasdaqGS:HNVR) | $16.48 | $32.76 | 49.7% |
USCB Financial Holdings (NasdaqGM:USCB) | $11.88 | $23.66 | 49.8% |
Bowhead Specialty Holdings (NYSE:BOW) | $24.18 | $46.81 | 48.3% |
Vasta Platform (NasdaqGS:VSTA) | $3.01 | $5.93 | 49.3% |
HeartCore Enterprises (NasdaqCM:HTCR) | $0.71395 | $1.41 | 49.2% |
BeiGene (NasdaqGS:BGNE) | $159.15 | $317.72 | 49.9% |
Open Lending (NasdaqGM:LPRO) | $5.79 | $11.30 | 48.7% |
Hesai Group (NasdaqGS:HSAI) | $4.30 | $8.33 | 48.4% |
Let's dive into some prime choices out of from the screener
Alnylam Pharmaceuticals
Overview: Alnylam Pharmaceuticals, Inc. is a biopharmaceutical company engaged in discovering, developing, and commercializing novel therapeutics based on ribonucleic acid interference, with a market capitalization of approximately $20.96 billion.
Operations: The company generates its revenue primarily from the discovery, development, and commercialization of RNAi therapeutics, totaling approximately $2.00 billion.
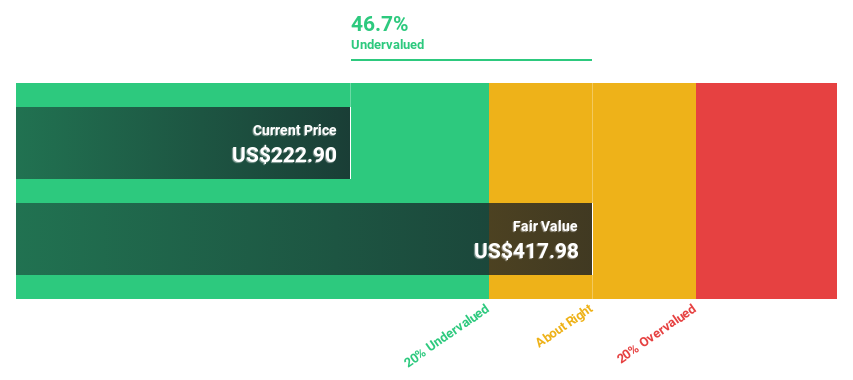
Estimated Discount To Fair Value: 46.7%
Alnylam Pharmaceuticals is positioned as an undervalued stock based on cash flows, trading at 46.7% below its estimated fair value of US$417.98 with a forecasted significant growth in earnings (63.8% per year) and revenue (19.5% per year), outpacing the US market average (8.6%). Despite its current non-profitability, Alnylam is expected to become profitable within three years, supported by robust projected returns on equity (98.4%). Recent successful Phase 3 studies of vutrisiran further underline potential future revenue streams and profitability enhancements.
New Oriental Education & Technology Group
Overview: New Oriental Education & Technology Group, with a market cap of $11.81 billion, is a provider of private educational services in China.
Operations: The company generates its revenue from private educational services in China.
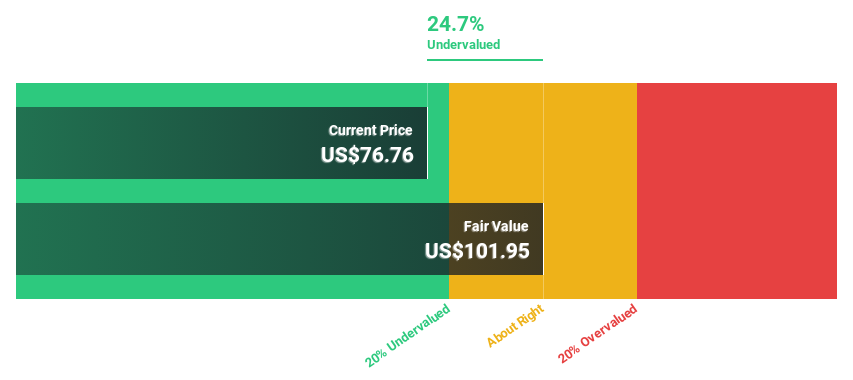
Estimated Discount To Fair Value: 24.7%
New Oriental Education & Technology Group is seen as undervalued based on cash flows, trading 24.7% below its estimated fair value of US$101.95. The company shows strong financial health with recent earnings growth and a robust revenue forecast, growing at 18.2% annually, surpassing the US market's 8.6%. Despite this, its Return on Equity is projected to remain modest at 13.9%. Recent corporate actions include an extended buyback plan and positive revenue guidance for Q4 FY2024, indicating confidence in continued financial performance.
Leidos Holdings
Overview: Leidos Holdings, Inc. operates globally, offering a range of services and solutions across defense, intelligence, civil, and health markets with a market capitalization of approximately $19.82 billion.
Operations: The company's revenue segments total approximately $15.71 billion, spanning defense, intelligence, civil, and health markets.
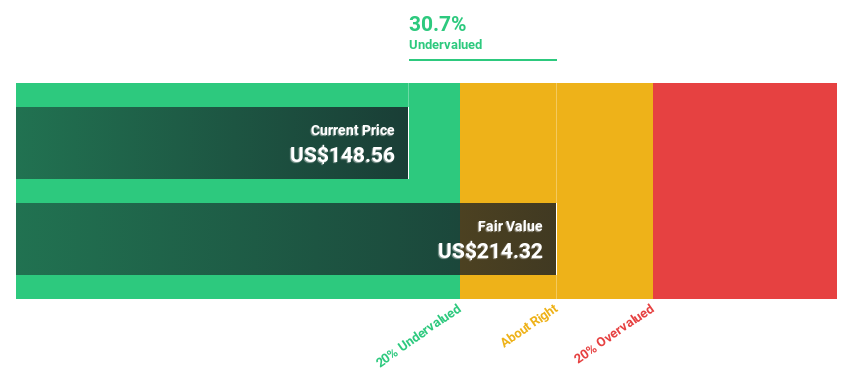
Estimated Discount To Fair Value: 30.7%
Leidos Holdings, recently awarded significant contracts including a US$738 million deal for IT and telecom support to the Air Force, appears undervalued based on cash flows. Despite slower revenue growth projections at 4.3% annually, its earnings are expected to grow substantially by 33.96% per year. Trading 30.7% below its estimated fair value of US$214.32, Leidos combines promising contract prospects with strong future earnings potential, although it is challenged by a high debt level and lower than last year's profit margins at 2%.
Make It Happen
Take a closer look at our Undervalued US Stocks Based On Cash Flows list of 180 companies by clicking here.
Already own these companies? Bring clarity to your investment decisions by linking up your portfolio with Simply Wall St, where you can monitor all the vital signs of your stocks effortlessly.
Elevate your portfolio with Simply Wall St, the ultimate app for investors seeking global market coverage.
Searching for a Fresh Perspective?
Explore high-performing small cap companies that haven't yet garnered significant analyst attention.
Diversify your portfolio with solid dividend payers offering reliable income streams to weather potential market turbulence.
Fuel your portfolio with companies showing strong growth potential, backed by optimistic outlooks both from analysts and management.
This article by Simply Wall St is general in nature. We provide commentary based on historical data and analyst forecasts only using an unbiased methodology and our articles are not intended to be financial advice. It does not constitute a recommendation to buy or sell any stock, and does not take account of your objectives, or your financial situation. We aim to bring you long-term focused analysis driven by fundamental data. Note that our analysis may not factor in the latest price-sensitive company announcements or qualitative material. Simply Wall St has no position in any stocks mentioned.
Companies discussed in this article include NasdaqGS:ALNY NYSE:EDU and NYSE:LDOS.
Have feedback on this article? Concerned about the content? Get in touch with us directly. Alternatively, email editorial-team@simplywallst.com
