
 Yahoo Finance
 Is Weakness In EOG Resources, Inc. (NYSE:EOG) Stock A Sign That The Market Could be Wrong Given Its Strong Financial Prospects?
With its stock down 12% over the past three months, it is easy to disregard EOG Resources (NYSE:EOG). However, stock prices are usually driven by a company’s financial performance over the long term, which in this case looks quite promising. In this article, we decided to focus on EOG Resources' ROE.
Return on equity or ROE is an important factor to be considered by a shareholder because it tells them how effectively their capital is being reinvested. In other words, it is a profitability ratio which measures the rate of return on the capital provided by the company's shareholders.
View our latest analysis for EOG Resources
How To Calculate Return On Equity?
The formula for return on equity is:
Return on Equity = Net Profit (from continuing operations) ÷ Shareholders' Equity
So, based on the above formula, the ROE for EOG Resources is:
31% = US$7.8b ÷ US$25b (Based on the trailing twelve months to December 2022).
The 'return' refers to a company's earnings over the last year. One way to conceptualize this is that for each $1 of shareholders' capital it has, the company made $0.31 in profit.
What Has ROE Got To Do With Earnings Growth?
Thus far, we have learned that ROE measures how efficiently a company is generating its profits. Depending on how much of these profits the company reinvests or "retains", and how effectively it does so, we are then able to assess a company’s earnings growth potential. Generally speaking, other things being equal, firms with a high return on equity and profit retention, have a higher growth rate than firms that don’t share these attributes.
A Side By Side comparison of EOG Resources' Earnings Growth And 31% ROE
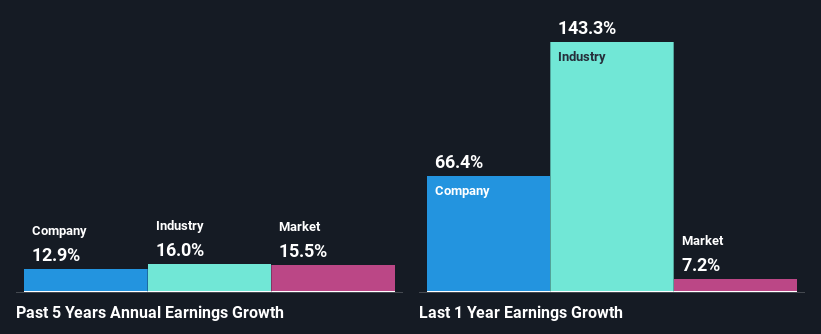
First thing first, we like that EOG Resources has an impressive ROE. Even when compared to the industry average of 30% the company's ROE is pretty decent. The high ROE therefore is what most likely laid the ground for the decent growth of 13% seen over the past five years by EOG Resources.
As a next step, we compared EOG Resources' net income growth with the industry and found that the company has a similar growth figure when compared with the industry average growth rate of 16% in the same period.
Earnings growth is a huge factor in stock valuation. The investor should try to establish if the expected growth or decline in earnings, whichever the case may be, is priced in. By doing so, they will have an idea if the stock is headed into clear blue waters or if swampy waters await. One good indicator of expected earnings growth is the P/E ratio which determines the price the market is willing to pay for a stock based on its earnings prospects. So, you may want to check if EOG Resources is trading on a high P/E or a low P/E, relative to its industry.
Is EOG Resources Efficiently Re-investing Its Profits?
With a three-year median payout ratio of 27% (implying that the company retains 73% of its profits), it seems that EOG Resources is reinvesting efficiently in a way that it sees respectable amount growth in its earnings and pays a dividend that's well covered.
Additionally, EOG Resources has paid dividends over a period of at least ten years which means that the company is pretty serious about sharing its profits with shareholders. Our latest analyst data shows that the future payout ratio of the company is expected to rise to 39% over the next three years. Consequently, the higher expected payout ratio explains the decline in the company's expected ROE (to 19%) over the same period.
Summary
Overall, we are quite pleased with EOG Resources' performance. Specifically, we like that the company is reinvesting a huge chunk of its profits at a high rate of return. This of course has caused the company to see substantial growth in its earnings. With that said, on studying the latest analyst forecasts, we found that while the company has seen growth in its past earnings, analysts expect its future earnings to shrink. To know more about the company's future earnings growth forecasts take a look at this free report on analyst forecasts for the company to find out more.
Have feedback on this article? Concerned about the content? Get in touch with us directly. Alternatively, email editorial-team (at) simplywallst.com.
This article by Simply Wall St is general in nature. We provide commentary based on historical data and analyst forecasts only using an unbiased methodology and our articles are not intended to be financial advice. It does not constitute a recommendation to buy or sell any stock, and does not take account of your objectives, or your financial situation. We aim to bring you long-term focused analysis driven by fundamental data. Note that our analysis may not factor in the latest price-sensitive company announcements or qualitative material. Simply Wall St has no position in any stocks mentioned.
Join A Paid User Research Session
You’ll receive a US$30 Amazon Gift card for 1 hour of your time while helping us build better investing tools for the individual investors like yourself. Sign up here
